Decades of research have identified what actually predicts college success — and it’s not just grades. General Academic’s new framework puts numbers to what admissions offices already know: the whole student matters.
Every fall, roughly 3.7 million American high school seniors begin what may be the most consequential bureaucratic process of their young lives: applying to college. They will agonize over personal essays, refresh portals for admission decisions, and spend months trying to answer a deceptively simple question: Am I ready for college?
It turns out nobody has a very good answer.
Ask a guidance counselor whether a student is college-ready, and you will likely hear something about GPA, maybe test scores, probably a hedged comment about “the whole student.” Ask a researcher, and you will get a more precise answer, but it will point in ten directions at once. There are studies on grit and growth mindset, on FAFSA completion rates and extracurricular duration, on self-regulated learning strategies and the predictive validity of class rank. Many frameworks have described college readiness in holistic terms. This scorecard’s contribution is to translate that broad idea into a one-sitting, student assessment that yields actionable insights for counselors.
Enter General Academic’s proprietary College Readiness Scorecard as a research-based framework for evaluating students across ten weighted dimensions, from academic achievement and testing to self-awareness, college knowledge, and financial preparedness. It produces a single, 1-to-9 readiness score grounded in a systematic review of 288 sources, including peer-reviewed studies, national surveys, and institutional reports. (Click here to read our full research analysis.)
The College Readiness Scorecard offers a a research-based diagnostic that can structure the college readiness conversation, identify specific gaps, and give students a concrete roadmap for preparation. The goal of this article is to share our analysis and show that every dimension, every weight, and every design choice rests on real research about what actually predicts college success.
But before examining how the scorecard works, it is worth understanding why existing tools fall short, and just how wide the gap between aspiration and enrollment has become.
Please note that the Scorecard is not a crystal ball. It has not yet been validated against college outcome data, and it should not be used for admission decisions, especially given the unique nature of every student.
Why is college readiness so hard to measure?
Here is a statistic that should trouble anyone who works in education: more than 90 percent of American tenth-graders say they aspire to earn a bachelor’s degree, yet fewer than half will enroll in and earn a bachelor’s degree or higher after high school. The gap between aspiration and enrollment is not primarily a gap in desire. It is a gap in preparation, information, and support, and we have remarkably few tools for measuring any of it.
The default metric for college readiness remains the high school GPA, and for good reason. A landmark study of 55,084 Chicago public school graduates found that high school GPAs are five times stronger than ACT scores at predicting college graduation. Students with GPAs above 3.5 had first-year retention rates 15 to 20 percentage points higher than those below 3.0. The evidence is so overwhelming that NACAC’s annual surveys consistently show 75 to 79 percent of colleges rate “grades in all courses” as “considerably important” in admission, the highest-rated factor for over a decade.
Yet GPA alone is a blunt instrument. It explains, at best, about 25 percent of the variance in college GPA. Three-quarters of what determines whether a student thrives or struggles in college is not captured by their high school transcript. The reason is straightforward: GPAs measure a very wide variety of skills and behaviors needed for success in college, where students will encounter widely varying content and expectations — in contrast, standardized tests measure only a small set of the skills that students need.
What about standardized tests?
Standardized tests like the ACT and SAT were supposed to provide the common yardstick. But the testing landscape has shifted tectonically. By 2023, test-optional policies had swept across higher education, and the percentage of admission officers rating test scores as “considerably important” had plummeted from 59 percent to under 5 percent. When 955,000 students at 33 institutions were tracked in the most comprehensive test-optional study to date, non-submitters performed nearly identically to test-submitters, with a GPA difference of just 0.05 on a 4.0 scale. Tests still add meaningful information (an incremental R-squared of 0.06 beyond GPA alone), but as a standalone readiness metric, they are clearly insufficient.
The Four Keys to College Readiness framework, which has shaped the field for two decades, framed the problem succinctly: “holistic” too often means “we consider many things” without specifying which things, how much each matters, or how any of them are measured. The field still lacks a framework that makes holistic review concrete, quantifiable, and transparent.
The good news is that researchers have been quietly building exactly that evidence base, and their findings are more conclusive than many practitioners realize.
What actually predicts college success?
Empirical evidence suggests that college success is best predicted through a multi-dimensional readiness assessment.
One particularly telling study used the nationally representative NELS:88 dataset of 12,144 students and applied machine learning methods to identify which combination of factors most accurately predicted college enrollment and persistence. The result: a model using just four constructs (academic preparation, postsecondary aspirations, socioeconomic context, and teacher perceptions of readiness) classified students with nearly 90 percent accuracy, compared to 79 percent from any single metric alone. That 11-percentage-point improvement is the core argument for composite scoring.
The research base behind this conclusion runs deep. ACT’s meta-analysis found that academic variables account for only about 25 percent of the variance in college GPA, while psychosocial factors such as academic self-confidence and achievement motivation add 13 percent incremental validity beyond academics alone. Three decades of research on noncognitive variables have demonstrated that an eight-dimension framework predicted GPA and persistence for diverse populations with classification accuracy between 63 and 75 percent. When the Gates Millennium Scholars program used that framework to select 11,000 scholars, weighting noncognitive variables at 80 percent, the results spoke for themselves: 97 percent first-year retention, 87 percent five-year retention, and 78 percent five-year graduation, all well above national averages.
These lines of research converge on a hierarchy of readiness factors. Academic achievement sits at the top:
- GPA above all, with course rigor close behind.
- In the middle, the behavioral and personal dimensions: extracurricular depth, college knowledge, personal qualities.
- At the base, the noncognitive and motivational factors that individually explain smaller portions of variance but collectively make the difference between aspiration and completion.
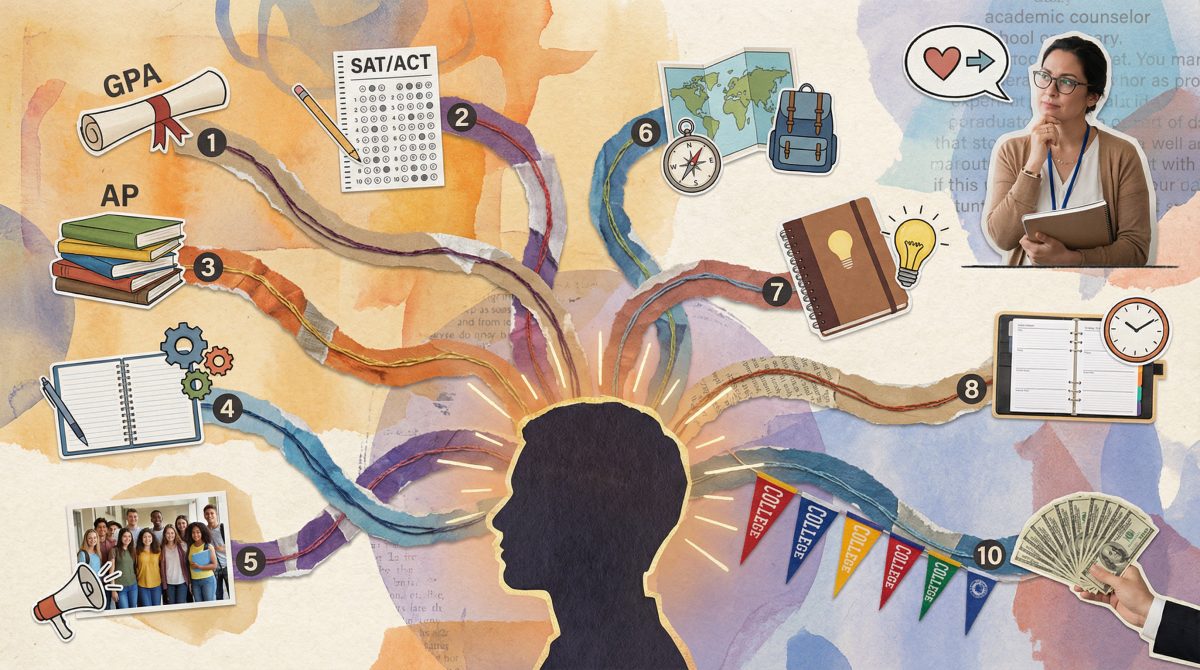
General Academic’s College Readiness Scorecard translates that hierarchy into a weighted composite score. So what does that composite actually look like in practice? Here is how the scorecard turns decades of converging evidence into ten scored dimensions.
What are the ten dimensions of college readiness?
The scorecard evaluates students across ten dimensions, each scored on a 1-to-9 scale and weighted according to its predictive importance:
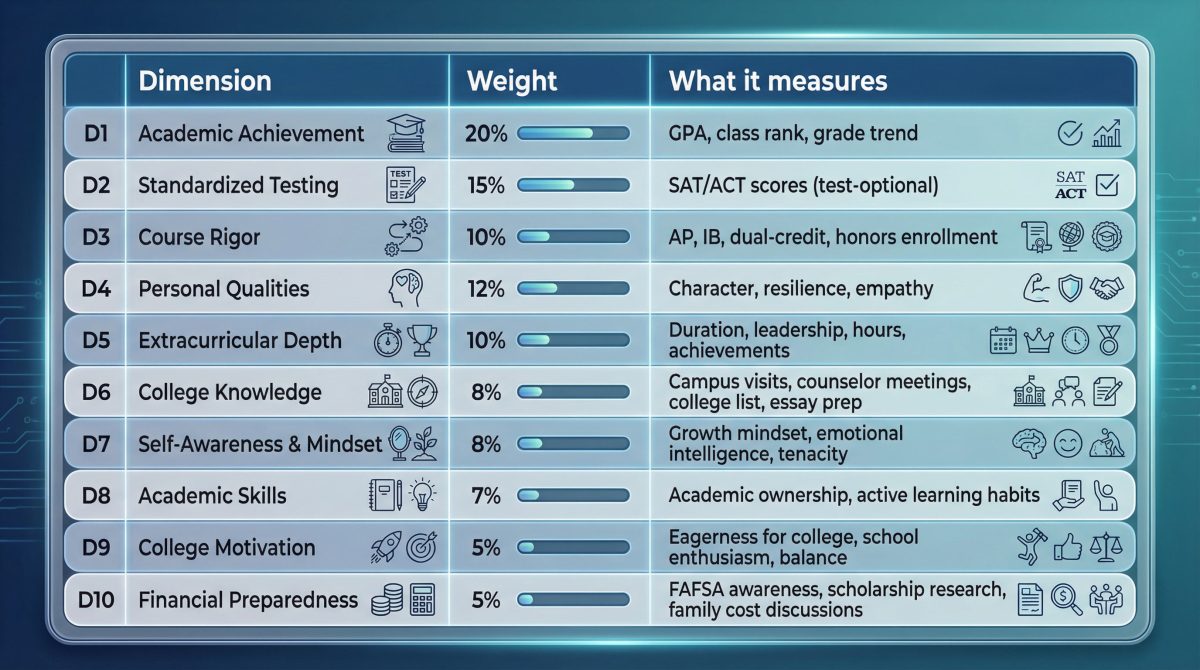
Academic factors (D1 through D3) carry 45 percent of the total, the largest share, reflecting decades of research establishing their primacy. But the remaining 55 percent is distributed across personal, behavioral, and noncognitive dimensions, reflecting the equally strong evidence that academics alone are not enough.
How much do grades, tests, and course rigor matter when applying to college?
Academic Achievement (D1, 20%) anchors the scorecard because the evidence demands it. GPA predicts first-year college GPA at r = 0.50 to 0.60 and six-year graduation at r = 0.40 to 0.50, with predictive validity holding across institutional selectivity levels from community colleges through elite universities.
Standardized Testing (D2, 15%) is designed to be test-optional. Students who do not submit scores receive a default of 3, placing them at “Developing” rather than penalizing them, a choice grounded in research showing non-submitters perform at roughly median levels in college and that the income-achievement gap in testing has widened approximately 40 percent over thirty years.
Course Rigor (D3, 10%) reflects the College Board’s definitive study of 400,000 students: even one AP exam increases four-year graduation by 3 percentage points, rising to 8 points for students scoring 3 or higher on two exams, but with benefits plateauing after five courses.
What role do character, activities, and college knowledge play in college applications?
Personal Qualities (D4, 12%) addresses what admission officers call “the art.” In its enhanced form, AI-assisted essay scoring draws on a study of 309,594 applicants finding that AI-generated quality scores correlated with human ratings at r = 0.74 with incremental validity consistent across demographic subgroups.
Extracurricular Depth (D5, 10%) emphasizes depth over breadth. Research shows that years of sustained participation predicted college enrollment and persistence more strongly than the number of activities. As the Harvard-led Turning the Tide report put it: numerous extracurricular activities or long “brag sheets” do not increase students’ chances of admission.
College Knowledge (D6, 8%) is a behavioral checklist grounded in specific research: one study found that college tours increased enrollment by nearly 30%, counselor meetings reduced work-only outcomes by 20% percent, and college search activity increased enrollment odds by 85%.
Do grit, mindset, and motivation matter in college applications?
Self-Awareness and Mindset (D7, 8%) draws on growth mindset research, a meta-analysis of 160 emotional intelligence studies across 42,000 students from 27 countries, and the growing body of grit research.
Academic Skills (D8, 7%) measures self-regulated learning. A meta-analysis of 225 studies found active learning increased exam grades by half a letter grade, while class attendance alone is a better predictor of college grades than any standardized admissions test.
College Motivation (D9, 5%) carries a deliberately conservative weight. Research on self-determination in college students found that those attending due to external pressure had 2.3 times higher attrition rates than those fulfilling autonomy and competence needs.
Financial Preparedness (D10, 5%) is the scorecard’s simplest dimension and arguably its most consequential for students who never make it to campus. Research has shown that simplifying FAFSA completion increased enrollment by 8 percentage points among low-income students. A 2024 Gallup/Lumina survey of 14,000 adults without degrees found 85 percent cited cost as the primary reason for not enrolling. Among all readiness domains measured by ACT researchers, financial preparedness scored lowest by a wide margin.
A framework this comprehensive carries responsibilities that extend well beyond its weights and dimensions. Not every student encounters these ten dimensions on equal footing.
Why context matters when measuring college readiness
No readiness score exists in a vacuum. General Academic’s College Readiness Scorecard is designed to broaden the conversation beyond grades and test scores, but no composite can fully account for differences in access, opportunity, and circumstance. Context remains essential to responsible interpretation.
By distributing weight across ten dimensions, it reduces dependence on any single metric: a student whose school offers no AP courses can still demonstrate readiness through grades, personal qualities, mindset, and financial preparedness. Research on noncognitive assessment has argued that these variables are especially important for students of color, women, first-generation students, and others with nontraditional backgrounds, but benefit all students.
The behavioral checklists (D6 and D10) function as roadmaps, not just assessments: when a student sees they have not visited a campus or researched scholarships, the checklist tells them exactly what to do next. And test-optional design at 15 percent weight reduces the influence of the metric most consistently shown to correlate with family income.
What are the scorecard’s limitations?
Though robust, the scorecard has natural blind spots. It does not adjust for opportunity gaps in course access, and it does not account for students whose extracurricular involvement is limited by work or caregiving responsibilities. A 5 from a well-resourced suburban high school means something different than a 5 from an under-resourced rural school where the nearest campus is a two-hour drive. Users should interpret scores in light of context.
What validation is still needed?
The most important limitation: the scorecard has not been validated against college outcome data. Every component rests on real research, but there is a meaningful distance between demonstrating that GPA predicts graduation and demonstrating that this particular weighted composite predicts outcomes better than simpler alternatives. Three validation studies are essential: predictive validity (tracking at least 5,000 students through enrollment and persistence), dimension intercorrelation analysis (testing whether ten dimensions actually measure distinct constructs), and equity analysis (comparing scores across demographic groups). Until that research is complete, the scorecard should be understood as a formative tool built from the research up, designed to guide college preparation conversations, not to gate college access.
How can counselors use a ten-dimension readiness profile?
Consider what a counselor can do with a readiness profile that breaks preparation into ten scored dimensions.
A student scoring 9 in Academic Achievement but 3 in Financial Preparedness does not need a general pep talk about “being college ready.” They need a specific conversation about FAFSA, about net price calculators, about the difference between sticker price and actual cost. Eighty-one percent of students eliminate colleges based on sticker price without waiting for financial aid offers, and a single conversation about costs can increase FAFSA completion by 25 percentage points. The scorecard does more than identify the gap: it names it, measures it, and suggests a concrete next step.
A student scoring 6 across academic dimensions but 4 in College Knowledge has the foundation to succeed but has not taken the steps (campus visits, counselor meetings, essay brainstorming) that research shows meaningfully increase enrollment.
A student scoring 5 overall but 8 in Self-Awareness and 7 in College Motivation has something no transcript captures: the internal orientation that research consistently associates with persistence through difficulty. The grit research, the growth mindset work, and the Gates Millennium Scholars’ extraordinary retention rates all point to the same conclusion: these qualities matter, and students who possess them deserve to know it.
Ninety percent of American tenth-graders aspire to a bachelor’s degree. Fewer than half will enroll. The distance between those numbers is not a mystery. It has been mapped by decades of research, study by study, dimension by dimension. What has been missing is a tool that puts all of that research into a form that a seventeen-year-old sitting across from a counselor can actually use.
The College Readiness Scorecard is a first attempt at building that tool. The evidence says it is asking the right questions. Whether it arrives at the right answers is a question that only validation can settle, and that validation, like the students the scorecard is meant to serve, is just getting started.
More about College Readiness from General Academic
For more than 22 years, General Academic has provided tutoring, test preparation, and consulting services while also publishing research-based resources like this one.
- College Counseling and Admissions Support Services from General Academic
- Should You Hire a College Admissions Consultant?
- How to Make a Balanced College List
- Texas High School Graduation Requirements
- College Application Timeline for Texas Students
This article was last updated on March 26, 2026.
References
- Allensworth, E. M., & Clark, K. (2020). High school GPAs and ACT scores as predictors of college completion. Educational Researcher, 49(7), 476-487.
- Beard, J. J., Hsu, J., Ewing, M., & Godfrey, K. E. (2023). Summarizing research on the relationships between the number of APs, AP performance, and college outcomes. College Board Research.
- Bowen, W. G., Chingos, M. M., & McPherson, M. S. (2009). Crossing the Finish Line: Completing College at America’s Public Universities. Princeton University Press.
- Conley, D. T. (2007). Toward a More Comprehensive Conception of College Readiness. Bill & Melinda Gates Foundation.
- Duckworth, A. L., Peterson, C., Matthews, M. D., & Kelly, D. R. (2007). Grit: Perseverance and passion for long-term goals. Journal of Personality and Social Psychology, 92(6), 1087-1101.
- Dweck, C. S. (2006). Mindset: The New Psychology of Success. Random House.
- Dynarski, S., & Scott-Clayton, J. (2006). The cost of complexity in federal student aid. National Tax Journal, 59(2), 319-356.
- Fredericks, J. A., & Eccles, J. S. (2006). Extracurricular involvement and adolescent adjustment. Applied Developmental Science, 10(3), 132-146.
- Freeman, S., et al. (2014). Active learning increases student performance in science, engineering, and mathematics. Proceedings of the National Academy of Sciences, 111(23), 8410-8415.
- Gallup/Lumina Foundation. (2024). State of Higher Education 2024. Survey of 14,000+ U.S. adults.
- Guiffrida, D., Lynch, M., Wall, A., & Abel, D. (2014). Do reasons for attending college affect academic outcomes? Journal of College Student Development.
- Klasik, D. (2012). The college application gauntlet. Research in Higher Education, 53(5), 506-549.
- Lira, B., et al. (2023). Using artificial intelligence to assess personal qualities in college admissions. Science Advances.
- Lotkowski, V. A., Robbins, S. B., & Noeth, R. J. (2004). The Role of Academic and Non-Academic Factors in Improving College Retention. ACT Policy Report.
- MacCann, C., et al. (2019). Emotional intelligence predicts academic performance: A meta-analysis. Psychological Bulletin, 146(2), 150-186.
- Making Caring Common. (2016). Turning the Tide. Harvard Graduate School of Education.
- NACAC. (2019, 2023). State of College Admission. National Association for College Admission Counseling.
- Niche. (2022). Student survey on college cost perceptions.
- Price, D. V., & Shireman, R. (2013). College attendance and academic skill development.
- Reardon, S. F. (2011). The widening academic achievement gap between the rich and the poor. In Whither Opportunity? Russell Sage Foundation.
- Sallie Mae/Ipsos. (2019). How America Pays for College. Annual survey.
- Schnieders, J. Z., Bobek, B., Moore, R., & Elchert, D. (2023). Supports key to the college preparation of students from the COVID cohort. ACT Research Report.
- Sedlacek, W. E. (2004). Beyond the Big Test: Noncognitive Assessment in Higher Education. Jossey-Bass.
- Sedlacek, W. E. (2011). Using noncognitive variables in assessing readiness for higher education. Readings on Equal Education, 25, 187-205.
- Soland, J. (2017). Combining academic, noncognitive, and college knowledge measures to identify students not on track for college. Readings on Equal Education.
- Syverson, S., Franks, V. W., & Hiss, W. C. (2018). Defining Access: How Test-Optional Works. NACAC.
- Westrick, P. A., et al. (2019). Validity of the SAT for predicting first-year grades and retention. College Board Research Report.
- Xing, X., Huerta, M., & Garza, T. (2019). College and career preparation activities and their influence on post-high school education. Career and Technical Education Research.