Many Houstonians have a Houston zip code but aren’t part of the Houston Independent School District (HISD). Spring Branch (SBISD) is one such district serving Houstonians but not part of HISD. In SBISD, Spring Branch Academic Institute stands on top as Spring Branch Independent School District (SBISD)‘s best elementary and middle school by Texas STAAR test scores. Other top elementary schools include Wilchester, Memorial Drive, Frostwood, and Rummel Creek. Other top middle schools are Cornerstone Academy, Memorial Middle, and Westchester Academy for International Studies.
Some of these top schools have special admissions processes. Spring Branch Academic Institute (SBAI) is SBISD’s school-within-a-school program for “highly gifted” students that score spectacularly on an IQ test as an elementary student and may even need to secure a spot via lottery on some years. At Cornerstone or Westchester, students participate in an IB curriculum, must maintain high GPA, and secure their spot via the Choice School Lottery.
As with nearly all standardized test results nationwide, the STAAR scores continue to show a nearly inextricable correlation with family wealth. In comparison with the much larger Houston ISD (HISD), SBISD is richer, which powers its overall higher scores. However, HISD’s sheer size enables it to offer just as many great schools as SBISD and many more “schools of choice” or magnet options that are application-based.
Texas STAAR Test Grading Levels
The State of Texas Assessments of Academic Readiness (STAAR) tests are the primary, quantitative measure of academic performance for Texas public schools. All public school students in grades 3-12 take some number of STAAR tests, although the testing is most consistent in grades 3-8. The STAAR is administered every spring in core subjects including reading, writing, mathematics, science, and social studies. The rankings in this article reflect the most recent test results from spring of 2026. Students’ scores are placed into four performance categories:
- Did Not Meet Grade Level – Like an “F” on a regular report card
- Approaches Grade Level – C
- Meets Grade Level – B
- Masters Grade Level – A
“Masters Grade Level” is the highest performance score level that a Texas public school student can achieve. How many students reach this designation on the STAAR test varies fairly significantly between grades and subjects, but generally, in 2026, if an elementary school student achieved a “Masters” level in math, they scored in the top 19% of students, and if they achieved it in ELA, they scored in the top 25% of students. If a middle school student achieved a “Masters” level in math, they scored in the top 9% of students, and if they achieved it in ELA, they scored in the top 28% of students.
The Texas Education Agency (TEA) asserts that students who score in the top two levels, “Meets” or “Masters,” have a more than 60% chance of passing college courses. As such, the “Masters” level, and the top part of the “Meets” level is essentially the percent of the population that is expected go on to earn a four year college degree. A Texas public school’s Report Card will always show the percentage of enrolled students who scored in each of the four performance categories.
Family Income Plays an Outsized Role
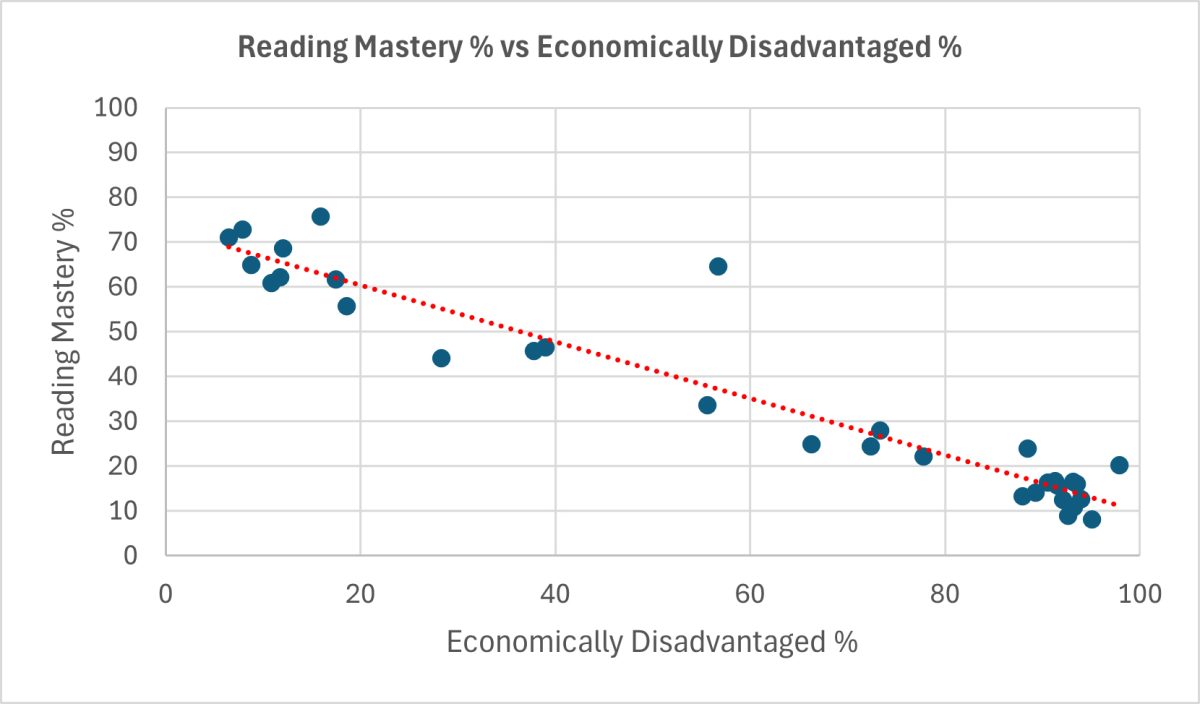
The biggest indicator of success on a school’s test scores is the family wealth of its student population. General Academic calculated the weighted R-squared (R²) values between percent of students mastering the STAAR and the percentage of students who qualify for federal free and reduced lunch. R-Squared is a standard statistical measure to determine how predictable a dependent variable (STAAR scores) is simply by looking at the independent variable (family income).
In Texas, a family of four typically qualifies for a reduced price lunch when their household income is below $57,720 (185% above poverty level) or a free lunch when their household income is below $40,560 (130% above poverty). Among all the subject and grade levels we analyzed, elementary school reading showed the strongest relationship between poverty level and test mastery. Up to 94% of the variation in those reading scores can be predicted from the percentage of economically disadvantaged students:
- Elementary School Reading Mastery – .940 R² correlation
- Elementary School Math Mastery – .747
- Middle School Reading Mastery – .881
- Middle School Math Mastery – .837
This seemingly inextricable link between family income and academic results does change over time. Students’ scores in reading go up – the R-squared value falls from .940 at elementary school to .881 in middle school. However, student’s scores in math remain strongly linked to family income – the R-squared value even increases slightly from .747 to .837.
Improve Your Child's Math & Reading Skills
Learn more about General Academic's Elementary Learning ProgramFor 1st through 5th grade elementary students, our Elementary Learning program for math and English is a superior alternative to strip mall learning centers. Twice a week, students meet privately with one of our brilliant tutors working through our personalized curriculum. Click here to learn more.
Top Spring Branch ISD Elementary Schools by STAAR “Masters” Scores
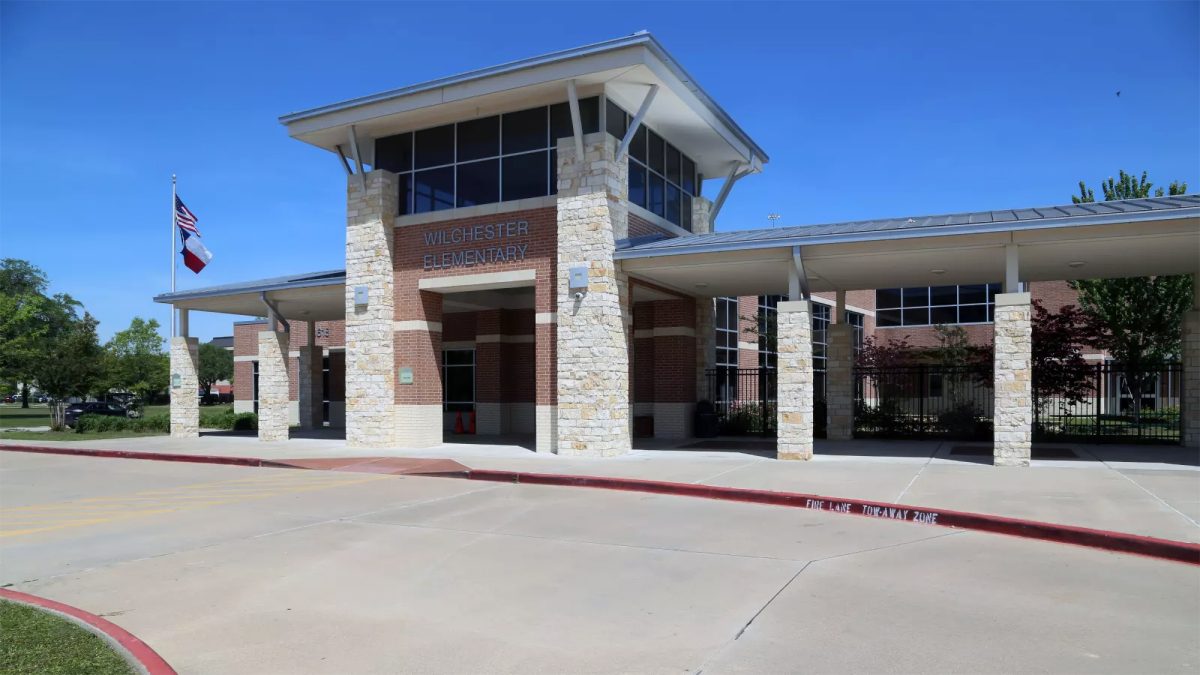
Wilchester Elementary, the second overall elementary school in SBISD based on STAAR scores
The best Spring Branch ISD elementary schools are SBAI, Wilchester, and Memorial Drive. Frostwood and Rummel Creek are tied in the fourth/fifth spots. This is the same top-five that we saw in 2025, though most of these schools saw moderate gains across their scores. SBAI’s combined master level rose by four percentage points, Wilchester and Memorial by one each.
In the top ten, the largest change in score was in Nottingham Elementary, whose combined mastery level rose by seven percentage points (+six for math and +eight for reading). Thanks to these gains, Nottingham overtook Hunter’s Creek for the eighth spot, a particularly impressive feat, given that Hunter’s Creek improved their math mastery level by eight points.
Since the STAAR is a peer-normed test in which only about 22% of elementary students will earn the “Masters” designation, any school on this list with higher than 22% is performing better than average. There are at least 12 (50% of the district) SBISD elementary schools that are outperforming the Texas state average.
The table below shows the percent of students scoring at the “Masters” level on the STAAR test in math, reading, and their combined average. Additionally, “Disadvantaged” indicates the percentage of enrollment that qualifies for a free or reduced lunch.
Unsurprisingly, schools with higher percentages of disadvantaged students tend to have worse STAAR results. Wilchester bucks this trend: at 11%, it has a larger percentage of disadvantaged students than the next four schools in our ranking. Nottingham (eighth) is perhaps even more notable here: it has almost twice the percentage of disadvantaged students than Hunter’s Creek (ninth), and 10% more than Meadow Wood (tenth).
On the other hand, Terrace Elementary is performing worse than would be expected: although it has a fairly large percentage of disadvantaged students at 76%, the four schools ahead of it in our ranking have percentages that are in the 90s.
Spring Branch ISD Elementary Schools by STAAR Score
| wdt_ID | wdt_created_by | wdt_created_at | wdt_last_edited_by | wdt_last_edited_at | Rank | Organization | Combined | Mathematics | Reading | Disadvantaged |
|---|---|---|---|---|---|---|---|---|---|---|
| 1 | hannahkelly | 10/08/2026 04:56 PM | hannahkelly | 10/08/2026 04:56 PM | 1 | SPRING BRANCH ACADEMIC INSTITUTE | 93% | 92% | 94% | 0% |
| 2 | hannahkelly | 10/08/2026 04:56 PM | hannahkelly | 10/08/2026 04:56 PM | 2 | WILCHESTER EL | 65% | 66% | 64% | 11% |
| 3 | hannahkelly | 10/08/2026 04:56 PM | hannahkelly | 10/08/2026 04:56 PM | 3 | MEMORIAL DRIVE EL | 63% | 55% | 70% | 7% |
| 4 | hannahkelly | 10/08/2026 04:56 PM | hannahkelly | 10/08/2026 04:56 PM | 4 | FROSTWOOD EL | 60% | 59% | 62% | 8% |
| 5 | hannahkelly | 10/08/2026 04:56 PM | hannahkelly | 10/08/2026 04:56 PM | 5 | RUMMEL CREEK EL | 60% | 52% | 67% | 7% |
| 6 | hannahkelly | 10/08/2026 04:56 PM | hannahkelly | 10/08/2026 04:56 PM | 6 | VALLEY OAKS EL | 59% | 53% | 64% | 9% |
| 7 | hannahkelly | 10/08/2026 04:56 PM | hannahkelly | 10/08/2026 04:56 PM | 7 | BUNKER HILL EL | 54% | 46% | 62% | 13% |
| 8 | hannahkelly | 10/08/2026 04:56 PM | hannahkelly | 10/08/2026 04:56 PM | 8 | NOTTINGHAM EL | 48% | 42% | 54% | 36% |
| 9 | hannahkelly | 10/08/2026 04:56 PM | hannahkelly | 10/08/2026 04:56 PM | 9 | HUNTERS CREEK EL | 46% | 41% | 52% | 19% |
| 10 | hannahkelly | 10/08/2026 04:56 PM | hannahkelly | 10/08/2026 04:56 PM | 10 | MEADOW WOOD EL | 36% | 28% | 45% | 28% |
| Rank | Organization | Combined | Mathematics | Reading | Disadvantaged |
Top Spring Branch ISD Middle Schools by STAAR “Masters” Scores

Cornerstone Academy, the second overall middle school in SBISD based onSTAAR scores
The top five Spring Branch ISD middle schools are SBAI, Cornerstone Academy, Memorial Middle, Westchester, and Spring Branch Middle.
The top six schools remain unchanged from 2025 to 2026. Of these, SBAI, Cornerstone Academy, and Spring Branch Middle, saw modest gains in their combined mastery level (+two, +five, and +one percentage point respectively).
Although its ranking did not change, Memorial Middle’s combined mastery level dropped by four percentage points, driven by an eight point drop in their math mastery level.
These six schools (60% of the district) are performing better than the Texas state average since more than 18% of their students are earning the “Masters” designation.
There was more movement in the next four schools, which are performing worse than the state average, when comparing the 2025 to the 2026 STAAR results: Spring Oaks Middle dropped from seventh to ninth, and Northbrook Middle rose from 10th to tie in the eighth spot. All four of these schools saw small gains in their combined mastery levels: Landrum +two, Northbrook +five, Spring Oaks +one, and Spring Woods +two).
This means that Northbrook tied Cornerstone for the largest gains in their STAAR results for 2026.
The table below shows the percent of students scoring at the “Masters” level on the STAAR test in math, reading, and their combined average. Additionally, “Disadvantaged” indicates the percentage of enrollment that qualifies for a free or reduced lunch.
Spring Branch ISD Middle Schools by STAAR Score
| wdt_ID | wdt_created_by | wdt_created_at | wdt_last_edited_by | wdt_last_edited_at | Rank | Organization | Combined | Mathematics | Reading | Disadvantaged |
|---|---|---|---|---|---|---|---|---|---|---|
| 1 | hannahkelly | 10/08/2026 04:58 PM | hannahkelly | 10/08/2026 04:58 PM | 1 | SPRING BRANCH ACADEMIC INSTITUTE | 96% | 92% | 100% | 0% |
| 2 | hannahkelly | 10/08/2026 04:58 PM | hannahkelly | 10/08/2026 04:58 PM | 2 | CORNERSTONE ACADEMY | 75% | 65% | 86% | 15% |
| 3 | hannahkelly | 10/08/2026 04:58 PM | hannahkelly | 10/08/2026 04:58 PM | 3 | MEMORIAL MIDDLE | 55% | 41% | 70% | 10% |
| 4 | hannahkelly | 10/08/2026 04:58 PM | hannahkelly | 10/08/2026 04:58 PM | 4 | WESTCHESTER ACADEMY FOR INTERNATIONAL STUDIES | 51% | 38% | 65% | 49% |
| 5 | hannahkelly | 10/08/2026 04:58 PM | hannahkelly | 10/08/2026 04:58 PM | 5 | SPRING BRANCH MIDDLE | 41% | 28% | 54% | 36% |
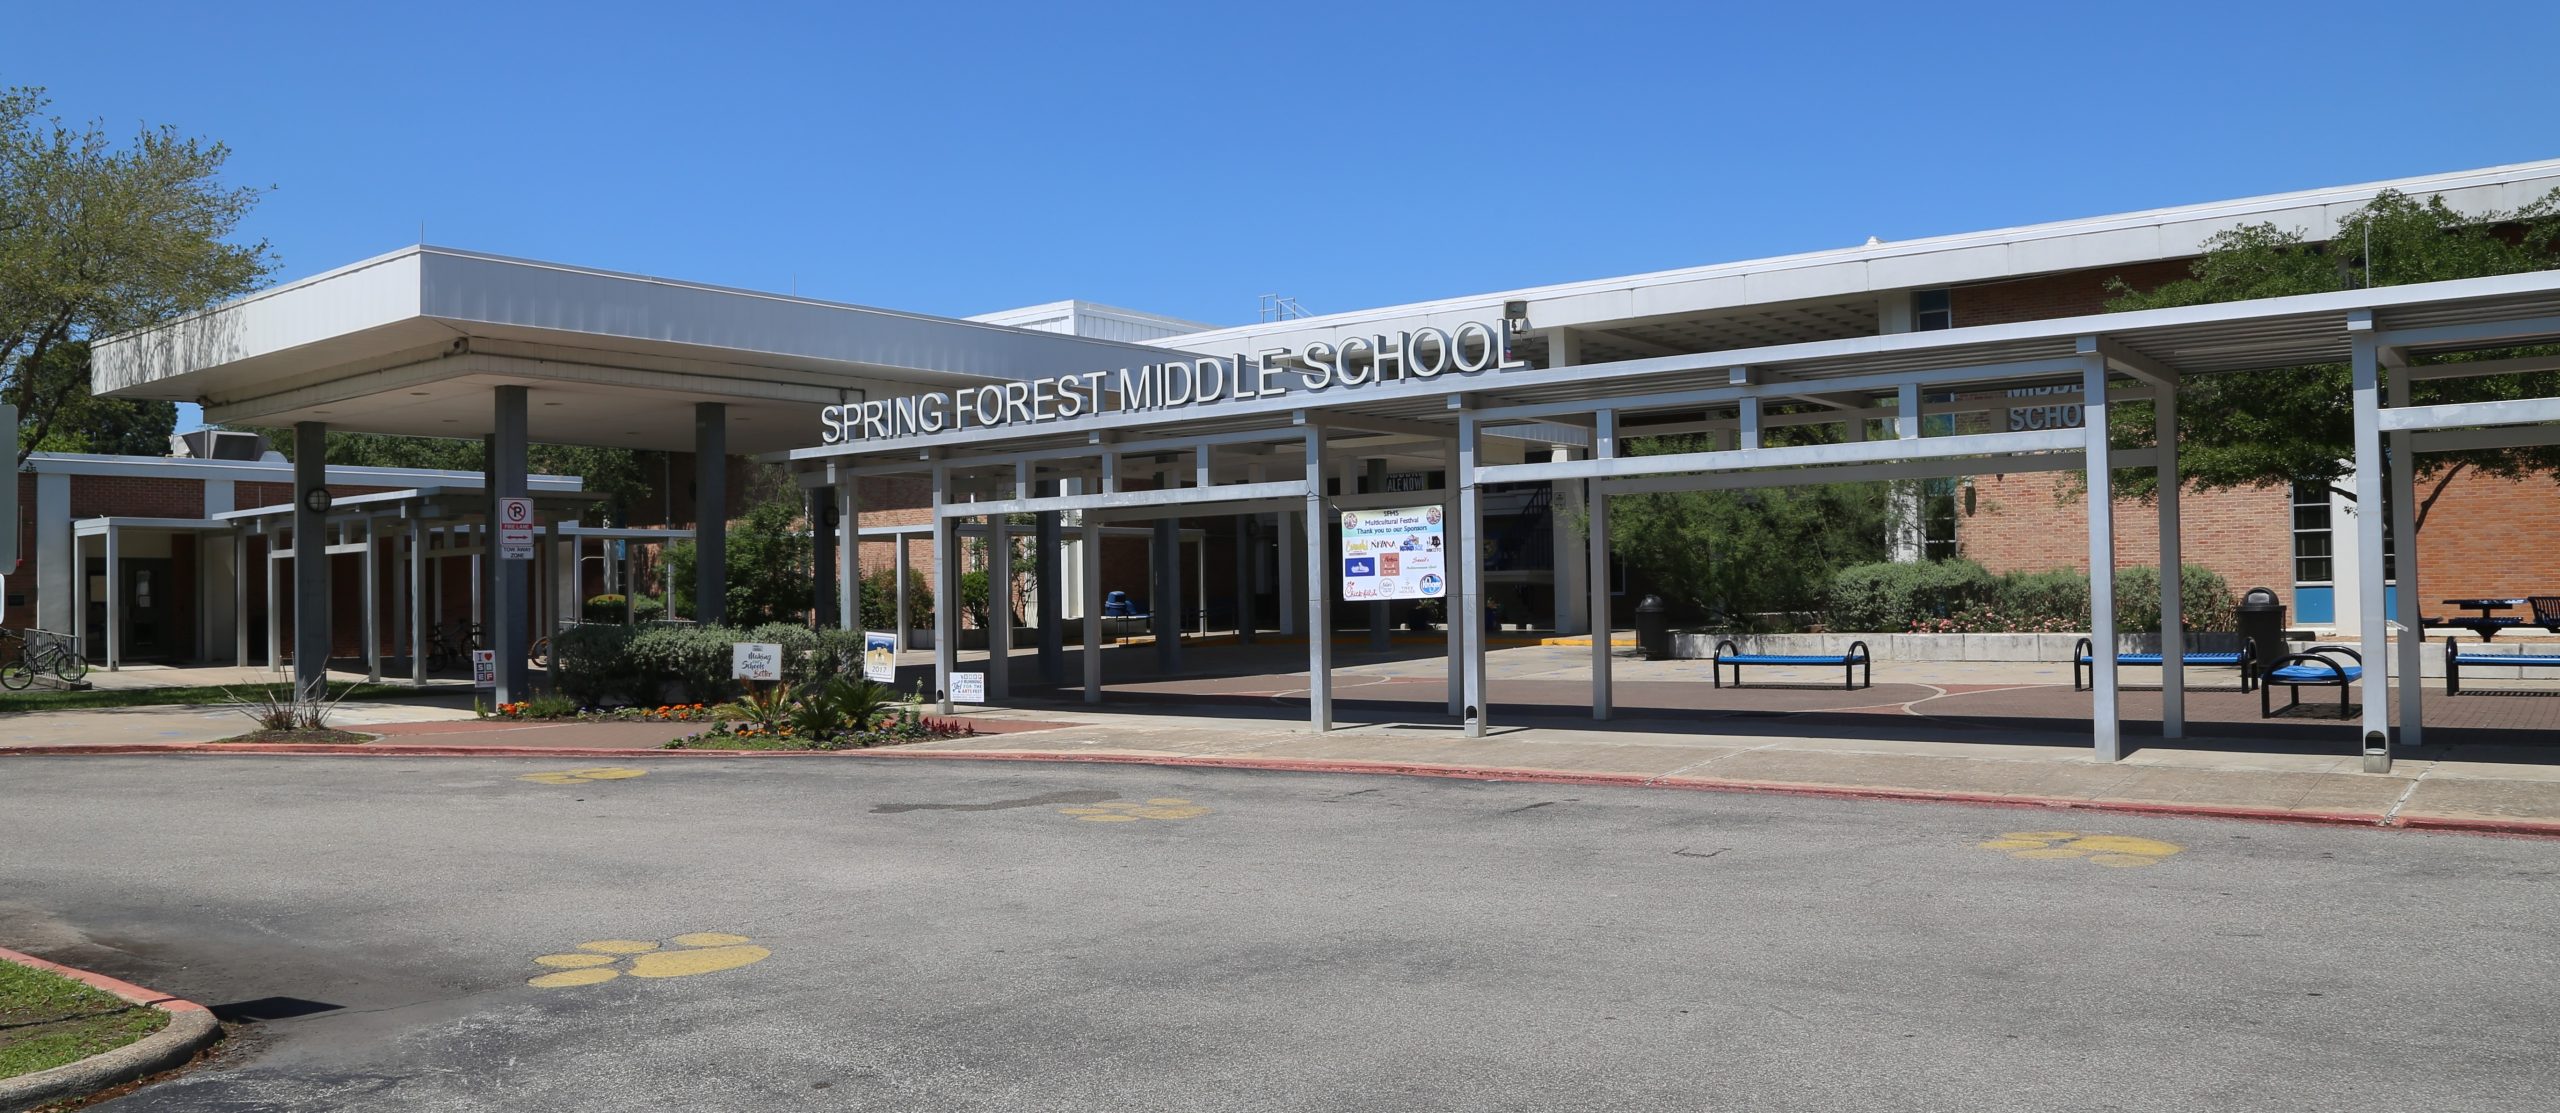
| 6 | hannahkelly | 10/08/2026 04:58 PM | hannahkelly | 10/08/2026 04:58 PM | 6 | SPRING FOREST MIDDLE | 24% | 12% | 35% | 52% |
| 7 | hannahkelly | 10/08/2026 04:58 PM | hannahkelly | 10/08/2026 04:58 PM | 7 | LANDRUM MIDDLE | 12% | 4% | 21% | 91% |
| 8 | hannahkelly | 10/08/2026 04:58 PM | hannahkelly | 10/08/2026 04:58 PM | 8 | NORTHBROOK MIDDLE | 11% | 8% | 14% | 97% |
| 9 | hannahkelly | 10/08/2026 04:58 PM | hannahkelly | 10/08/2026 04:58 PM | 9 | SPRING OAKS MIDDLE | 11% | 4% | 19% | 89% |
| 10 | hannahkelly | 10/08/2026 04:58 PM | hannahkelly | 10/08/2026 04:58 PM | 10 | SPRING WOODS MIDDLE | 10% | 3% | 16% | 98% |
| Rank | Organization | Combined | Mathematics | Reading | Disadvantaged |
Comparing Spring Branch to Houston ISD
If you find yourself in a position where you need to compare the options between Spring Branch and the larger HISD, here are some key observations. SBISD serves just over 33,000 students while HISD has just shy of 177,000 students. In SBISD, 53.4% of students qualify for free or reduced lunch, while in HISD, nearly 80% of students qualify.
Both districts possess a variety of campuses: high performing schools in wealthier neighborhoods, lower performing schools with primarily disadvantaged populations, and every where in between. Both districts boast several schools that perform at or above the state average for STAAR Mastery while having a strong majority of their popular on free or reduced lunches. Top schools in each district are extremely competitive with one another. The lowest schools in each district face similar struggles.
At the Elementary Level, ignoring GT Schools, HISD’s West University boasts a 83% average mastery, which eclipses SBISD’s Wilchester, Memorial Drive, and Rummel Creek that have combined masteries in the lower 60% range while having comparable, single digit disadvantaged percent. At the Middle Level, ignoring GT Schools, SBISD’s Cornerstone Academy has a leading 75% combined mastery over HISD middle schools, even when comparing to a similar “application only” lottery school like Pin Oak whose combined mastery is at 54%.
The differences appear in the overall distribution for each district. SBISD has a higher proportion of their schools above the STAAR mastery state average: 50% of SBISD vs only 43% of HISD at the elementary level and 60% of SBISD vs only 47% of HISD at the middle level. Yet when looking at family economic levels across districts we see the smaller SBISD is made up of a larger proportion of higher income schools than HISD. Ten out of 24 SBISD elementary schools and five out of 10 SBISD middle schools have student populations with less than half disadvantaged families. Only 25 of 153 HISD elementary schools and 9 of 54 HISD middle schools have under 50% of their population as disadvantaged.
On a percentage average, SBISD performs higher and has wealthier neighborhoods than HISD, but HISD has the quantity advantage. The amount of HISD schools that are performing above the state average nearly matches the total number—of all SBISD campuses.
Both districts offer application-based schools of choice, but HISD’s size allows it to offer more options. SBISD only has 2 academic based choice options and 6 dual language options across all grade levels. HISD has 128 magnet schools within their district with a broader variety of program focuses. The top choices within each district will still have availability issues, no matter how large or small their population. A lottery has to be used to distribute the limited available spots on each campus.
Read More about Houston-Area Schools from General Academic
- Houston ISD’s Best Elementary and Middle Schools by STAAR Scores
- Houston’s Top High Schools by SAT Scores
- Houston’s National Merit Semifinalists for 2025-2026
About the Data
This dataset was compiled from data pulled from TEA Assessment Research Portal, from the 2025-2026 school year, specifically the Spring 2026 STAAR data. The two data tables represent Grades 3-5 average performance for elementary schools, and Grades 6-8 average performance for middle schools. “Percent Mastery” scores for both Math and Reading represent the total number of students at a school who earned a performance level of “Mastery” in the respective STAAR 3-8 subject, divided by the total number of students at the same school who took the STAAR 3-8 exam for that subject. The “average mastery” column in the tables above is simply the average of the math and reading scores. The data regarding percentage of economically disadvantaged students comes from Children at Risk. For an interactive map of Houston-area school districts with schools, visit the TEA’s website.