
Analysis of Houston School Choice Lottery for 2025-2026
The most popular Houston ISD (HISD) magnet schools for 2024-2025 are Harvard Elementary School, Pin Oak Middle School, and DeBakey High School. The application cycle for the 2025-2026 school year took place the previous year, between 2024-2025.
Families had relatively decent chances of winning the lottery for admission to a desirable HISD magnet school for kindergarten (25% chance), sixth (29%), or ninth grade (30%)—the prime entry years for elementary, middle, and high school respectively. Compared to our analysis from two years ago, students had a better chance of admission to preferred schools. For admission for the 2023-2024 academic year, chances of admission to the top third of magnet programs was 19% for elementary, 24% for middle, and 23% for high school.
Overall, applications to HISD magnet schools have fallen since our last analysis two years ago, and qualified applicants had a higher chance of admission to their desired school. A total of 13,151 students, about 7% of the district’s enrollment, submitted 34,625 applications during Phase I of the lottery. On average, each student applied to 2.6 magnet programs, and only less than 14% of applications submitted were deemed “unqualified,” meaning that few students lacked the requirements to attend a certain school—such as being gifted and talented, being an exceptional artist, or possessing foreign language skills.
Who Participated in the HISD School Choice Lottery
As with previous years, applicants in this year’s School Choice Lottery were disproportionately Asian and White. Forty-three percent of students in the lottery self-identified as White, but only 10% of HISD’s enrollment is White, meaning that White students were overrepresented by 443%.
Asian students were overrepresented by 135% (12% of lottery vs 5% of district). Black students were represented nearly proportionately (20% vs 21%) but Hispanic students were underrepresented by about 77% (47% vs 62%).
Lottery participants were most interested in middle and high schools. Approximately 27% of would-be 6th and and 34% of rising 9th graders participated in the lottery versus just 14% of would-be kindergarteners.
After HISD adopted a new application for the 2022-2023 school year, the district stopped tracking data about family income. However, in the last year that the district collected the data, the non-economically disadvantaged were overrepresented in the lottery by over 250%.
The Best Houston Schools and Popularity in the Magnet Lottery
Identifying what defines a “good school” is a little like trying to compare the children that attend them—it’s highly subjective. For many parents, good schools are defined by high test scores, national and state recognition, or a faculty that truly cares about the students, builds strong relationships, and leads the students to feel comfortable and supported. For other parents, a good school is just one in a wealthy neighborhood or with new buildings.
HISD’s annual School Choice lottery is a unique opportunity for the traditional market forces of supply and demand to identify the district’s best schools. Whereas most families live in areas where they must attend a specific neighborhood school, the lottery enables every family in Houston to apply for a chance to attend a school of their choice. Assuming that market forces work correctly, the “most desirable Houston schools” will therefore also be the ones that receive the most applications in the prime entry years.
Magnet Schools Are Also Up for Review in State Takeover
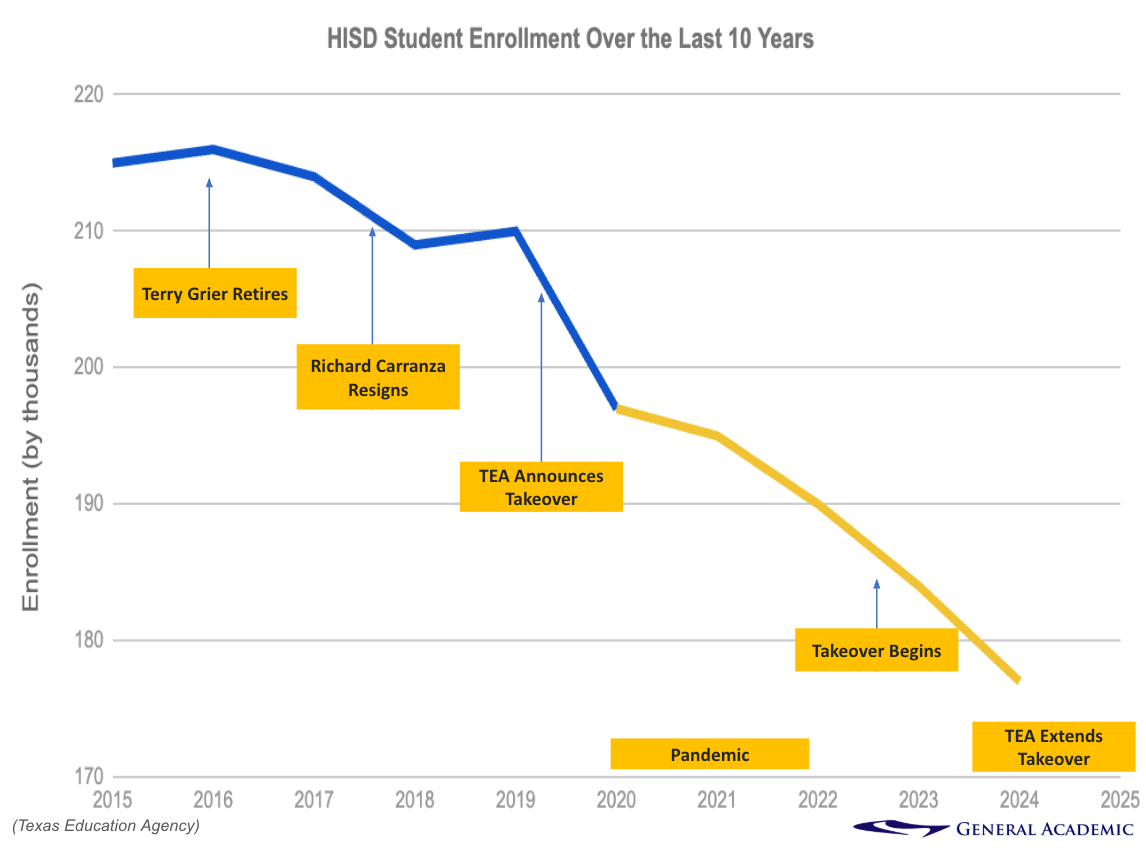
The number of students enrolled in HISD continues to fall in stark contrast to Houston’s booming population. This school year marks the third after the state takeover of the district. Mike Miles, the state-appointed superintendent, has implemented big changes resulting in high teacher and principal turnover, more rigid curricula aimed at standardizing classroom routine and improving STAAR scores, and reduced student enrollment.
Most major reforms had previously been limited to lower-performing schools and not desirable magnet schools. However, magnet schools have not been immune to takeover reforms. Since the shift in district leadership, the Phase 1 magnet lottery timeline has shifted slightly to now occur from December to April, students currently enrolled in HISD can no longer participate in Phase III, and many magnet campuses have adopted Superintendent Miles’s New Education System curriculum. Some high-performing magnet schools may even outsource leadership to external organizations, facilitated by a 2017 Texas law that incentivizes districts to relinquish campuses to private entities.
According to Houston ISD, the 2025-2026 lottery timeline is below:
- Aug. 25, 2025: GT Testing Request Deadline
- Dec. 9, 2025: Phase One Application Opens
- Feb. 27, 2026: Phase One Application Deadline
- Apr. 8, 2026: Families are Notified of Phase One Lottery Results
- Apr. 8, 2026: Phase Two Application Opens
- Apr. 21, 2026: Deadline for Accepting Phase One Offers of Admission
The Phase II application deadline has not yet been announced.
Summary of Key Findings
- High STAAR and SAT scores plus affluent neighborhoods reinforce the perennial favorite middle and high schools.
- Overall participation in the lottery is down and the number of qualified applications has increased.
- The lottery pool is more competitive with more qualified applicants competing for a fixed number of seats.
- The lottery is very popular with affluent White and Asian families.
Introduction to the Houston ISD Magnet School Choice Lottery
While all students residing in Houston ISD are automatically accepted into the school in their zoned neighborhood, the annual School Choice lottery allows families to apply to magnet programs in other neighborhoods or to special schools that are “equal opportunity” in that none of the students come from the surrounding neighborhood.
The ability to attend an “out-of-zone” (OOZ) school is particularly appealing if families live in a neighborhood zoned to a relatively poor-performing school but cannot afford to spend an average of $3.9 million to buy or rent in the neighborhood zone of River Oaks Elementary, for example.
However, parents must pay attention to a school’s unique program and admissions requirements. While some magnet schools enforce no requirements other than families be residents within HISD’s attendance zone, many schools have minimum qualifications such as that students be designated as Gifted and Talented (River Oaks Elementary), have a talent for languages (Bellaire High School), or possess exemplary artistic ability (Pershing Middle School). About 14% of applications this year were automatically rejected, because students did not actually meet the qualifications to attend a certain school.
For the 2024-2025 lottery, students could have applied to a maximum of ten schools, and they had to rank their schools in order of preference. The rank order did not affect the outcome of the lottery; it only affected how students were placed on a waitlist. If a student was admitted into a school they ranked higher than another school, they would not have been waitlisted at their lower-ranked school. The intended effect of this policy is to shorten waiting lists for all schools.
Click here learn more about how to apply to an HISD magnet school.
Special Sibling Lottery Affords Best Chances to Currently Enrolled Families
Siblings of currently enrolled and continuing students have a greater chance of admission in HISD magnet schools because up to 25% of a school’s available seats are reserved exclusively for siblings. If more siblings apply than those 25% of reserved seats allow, then siblings get to participate in both the “sibling lottery” and the general lottery. At the top 19 elementary schools, less than 1% of Kindergarten applicants qualified for the sibling lottery for admission for the 2025-2026 school year.
The number of siblings participating also helps to show parent satisfaction with a school. If parents of a currently enrolled student are happy then it follows that they would be likely to try to send their younger children to the same school.
Timeline of the Phase I Lottery for the 2025-2026 Academic Year
For students applying in the lottery for admission into the 2025-2026 academic year, the 2024-2025 lottery deadline dates were as follows:
- Dec. 10, 2024: Phase I of the School Choice Lottery opened
- Mar. 20, 2025: Families were notified of the lottery results
- Apr. 3, 2025: Deadline for families to accept their offer of admission
Applicants are thrown into a randomized lottery. There are generally a few ways to gain an advantage:
- Take the necessary steps to be qualified to attend the desired school;
- Already have a sibling enrolled at a school and want to attend concurrently with the sibling next year;
- For pre-kindergarten only, qualify as disadvantaged.
Students may technically apply to most magnet schools up until the first day of school in August. However, applications submitted after Phase I are essentially guaranteed not to place into any desirable school, because all the seats would be already taken. Students will continually move off the waiting list until the first day of school.
How to Read the Top Houston School Tables Below
- Theme indicates the type of magnet school; parents can learn more about the different themes at HISD’s website
- Apps refers to the number of applications received
- Apps Q is the percentage of apps that are actually qualified to be considered for admission
- Seats is the number of spaces available to OOZ students and excludes availability for zoned students
- Accepted is the percent of student who accepted an offer of admission
- Siblings is the percent of applicants from siblings of currently enrolled students
- Home Value is the current average listing price of homes in the school’s neighborhood zone or immediate vicinity
- STAAR/SAT Math is the percent of all students at the school who earned the “Masters” designation on the STAAR/SAT math tests
- STAAR/SAT Reading is the percent of all students at the school who earned the “Masters” designation on STAAR/SAT reading tests
HISD presented these data as accurate on August 11, 2025. Click here to download the original dataset provided by Houston Independent School District (HISD).
Top Houston ISD (HISD) Magnet Elementary Schools for 2024-2025
The top Houston ISD magnet elementary schools for 2025 are Harvard, Kolter, Wharton Dual Language Academy, Lovett, and Mandarin Immersion Magnet School. Other top elementary schools include West University, Horn, and Condit; however, these schools are only available to zoned neighborhood students and not part of the lottery.
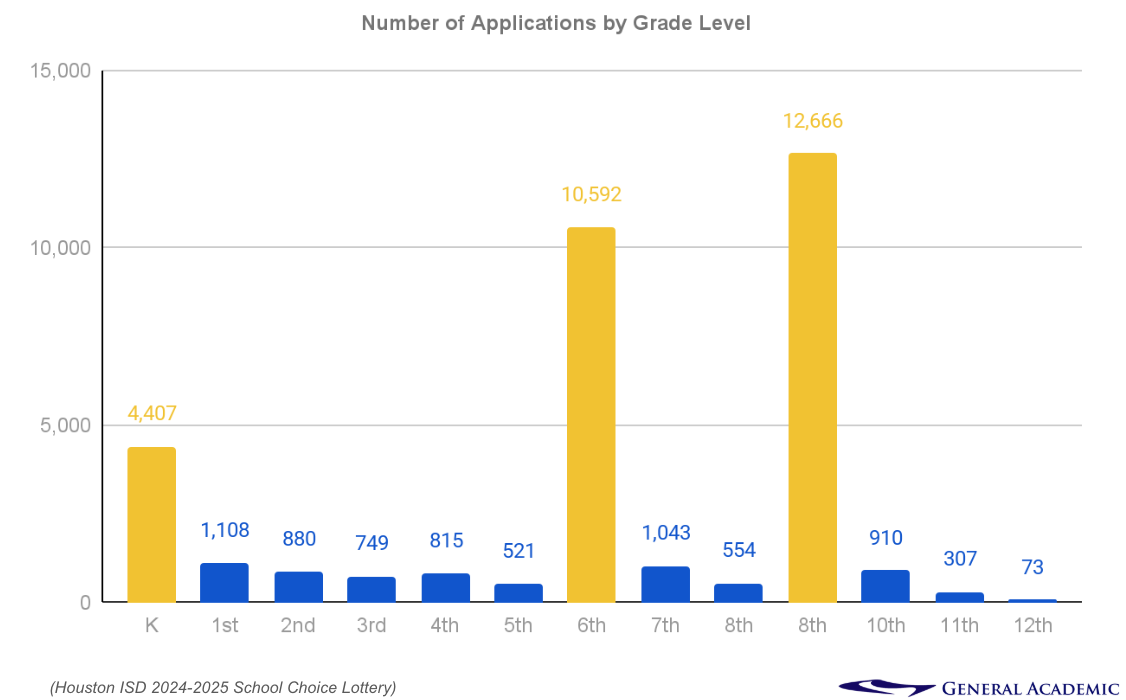
For students applying to the 2025-2026 academic year, 1,817 students submitted 4,407 kindergarten applications to 59 HISD elementary schools. The number of applicants was down 13.3% versus our last comparison. Kindergarten is the “prime entry” year for most HISD elementary schools, meaning that it is the year when most seats are available.
Harvard and Kolter Elementary Schools are the most popular by far, with applications jumping considerably by 116% and 105%, respectively, since our last analysis two years ago. The biggest surprise this year was Wharton Dual Language Academy which jumped considerably, jumping eight ranks in just two years*. Harvard, nestled in the Heights neighborhood, hosts a STEM magnet program; Kolter offers a foreign language magnet program in the Meyerland area; and Wharton (Montrose) nurtures bilingualism by enabling K-5 students to participate in the Spanish Dual Language Program and International Baccalaureate (IB) Primary Years Programme (PYP).

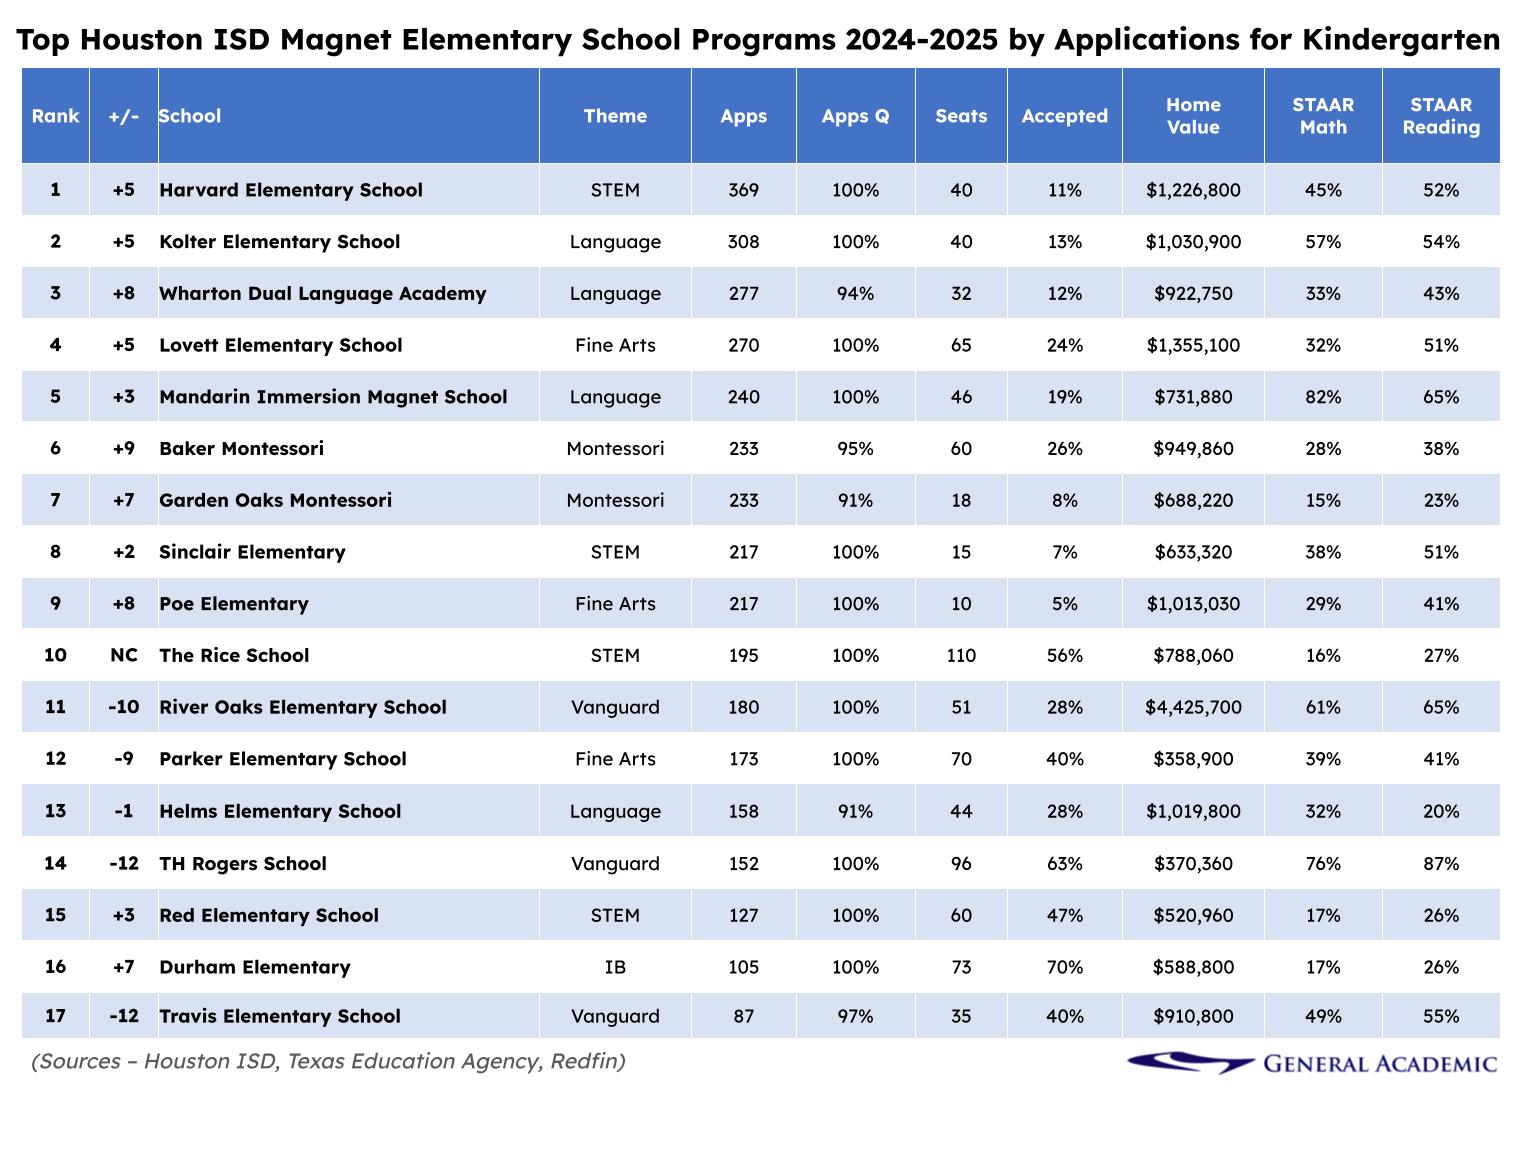
As the most popular choice, Harvard Elementary School received 369 kindergarten applications. Because Harvard has no qualification requirements, all applicants were deemed qualified. The school had 40 kindergarten seats available to lottery students, and 95% of applicants who received an offer of admission accepted. Students had an 11% chance of admission, and zero applicants were from siblings.
The top third of HISD’s magnet elementary schools collectively offered 948 kindergarten seats, which is 14% more seats available compared to our 2023 analysis. These 20 schools offered 36% of available seats but received 80% of the applications. At these top schools, parents had about a 25% chance of admission compared to 19% in 2023.
The biggest surprise this year came from TH Rogers, which decreased in its number of kindergarten applications by 69%. Historically a Houston favorite, TH Rogers is Houston’s sole application-only Vanguard magnet elementary school, meaning students must already have gifted and talented designation by HISD. While 100% of kinder applicants this year were G/T qualified, only 58% accepted their offers of admission. This drop in popularity could be due in part to a number of reasons: funding issues leading to the deterioration of facilities, fewer extracurricular options, reputation of low camaraderie and high competition among students, and teacher turnover since the TEA takeover.
The Best Performing HISD Elementary Schools are in Rich Neighborhoods
Some of the district’s top performing elementary schools by STAAR scores are inaccessible via magnet programs. West University, Roberts, Horn, Twain, and Bush elementary schools are not part of the magnet lottery, because their popularity among neighborhood families means that there is no space available to accommodate out-of-zone magnet transfers. These 5 schools are located in neighborhoods where home values generally exceed $1 million or more.
Unlike at the middle school and high school levels, HISD offers only a single “magnet-only” elementary school (TH Rogers) that does not have to serve both a zoned neighborhood population and magnet transfers. The result of this gap is that the best elementary schools will continue to “wealth-out” of the lottery as they become so popular with the neighborhood families that no space remains for out-of-zone transfers.
With the exception of Bush Elementary in far west Houston, inaccessible West University, Horn, Twain, and Roberts are in neighborhoods where home values generally exceed $1 million or more.
Top Houston ISD (HISD) Magnet Middle Schools for 2024-2025
The top Houston ISD middle schools are Pin Oak, Lanier, and Hogg. While fourth in popularity overall, TH Rogers is the district’s best middle school by STAAR test scores.
For students applying for the 2025-2026 academic year, 3,523 students submitted 10,592 applications for sixth grade to 39 HISD middle school magnet programs. Rising sixth graders applied to an average of 3 schools each, which was slightly more than their kindergarten and ninth grade counterparts. Sixth grade is the “prime entry” year for most HISD middle schools.
Pin Oak and Lanier remain the most popular middle schools in HISD. But TH Rogers, which used to hold the #3 spot, fell in popular ranking due to the large increase in applications for Hogg. However, TH Rogers is still #1 when it comes to its students’ STAAR performance.

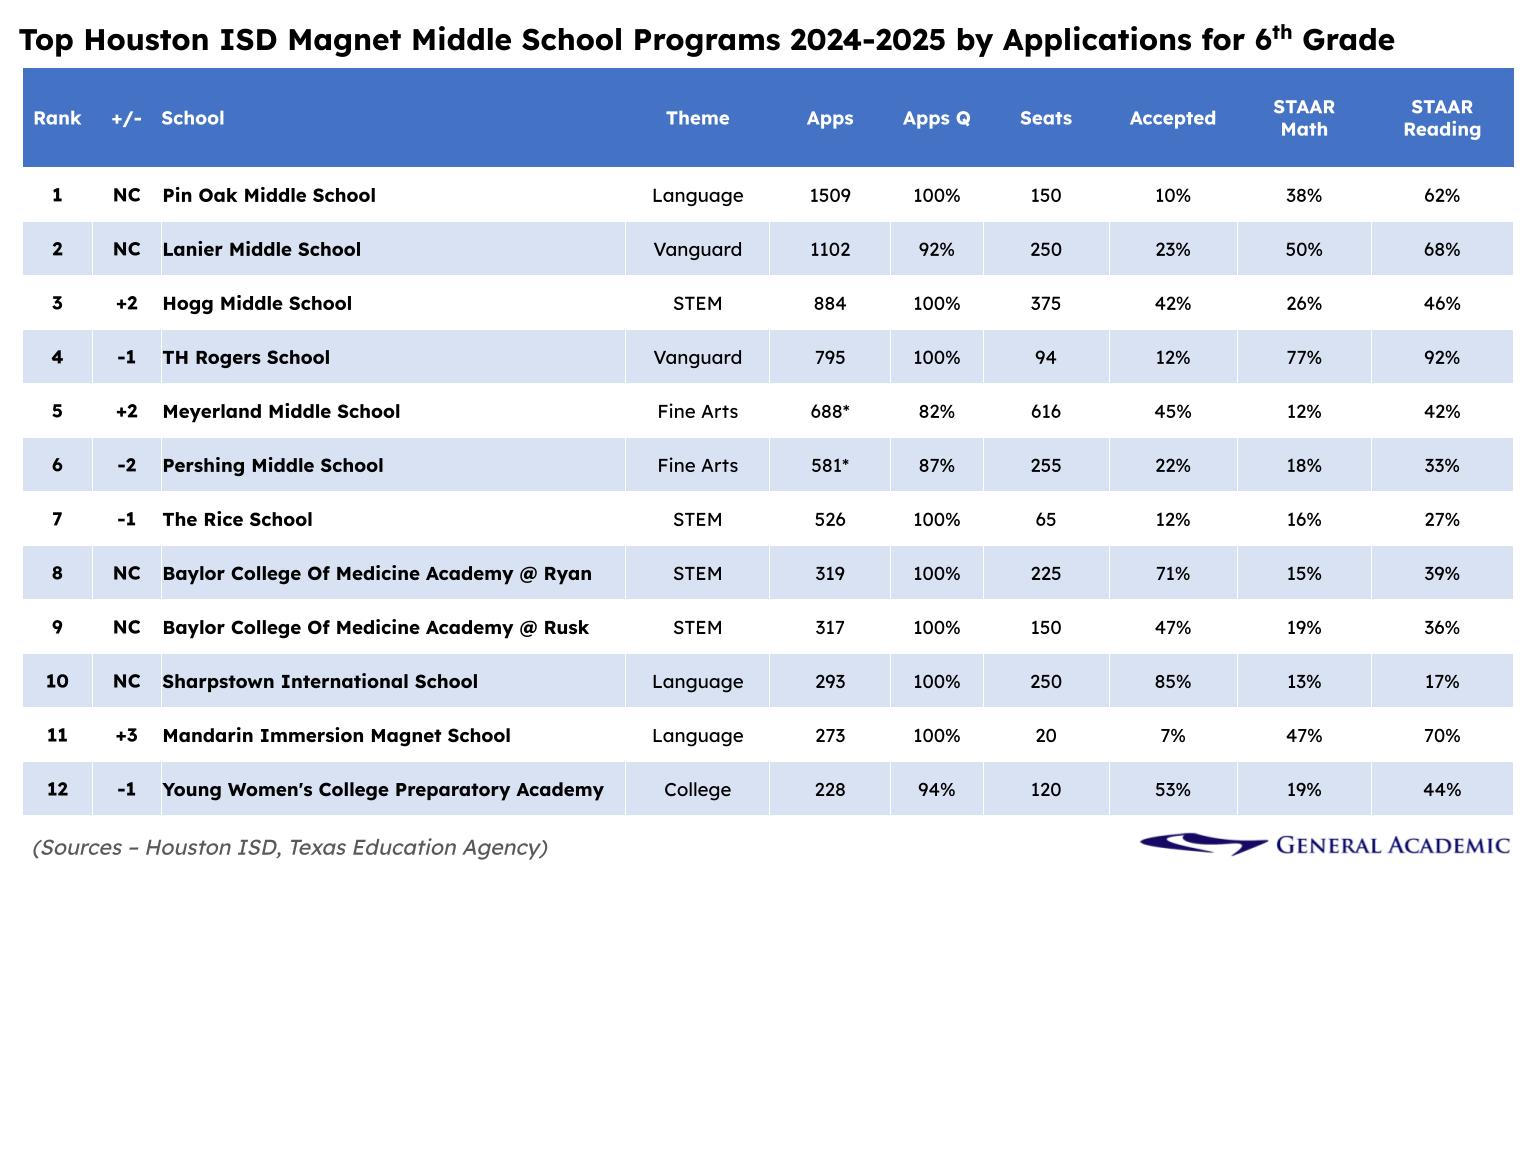
Of the top middle school magnet programs, families had a very good 33% chance of 6th grade admission; however, those chances fell to just 26% among the top five middle schools.
Pin Oak is one of the schools with consistently high “loyalty rates,” meaning that parents of currently enrolled students seemed happy enough to also want to send their younger children to the same school. Pin Oak could fill upwards of 19% of their available seats with just siblings alone. Only 25% of seats are reserved for siblings after which families must still participate in the general lottery.
There are two ways to attend Pin Oak Middle School—a “Boundary Option” and Language magnet; both programs require participating in the lottery. Families residing in the neighborhoods served by Jane Long Academy, Meyerland Middle School, or Pershing Middle School may apply to the Boundary Option program. Families who are eligible for the Boundary Option can and should also apply to the Language magnet to essentially double their chances of acceptance. No students are zoned to Pin Oak for automatic admission.
Middle School is when fine arts magnets start hosting auditions. For students applying for the 2025-2026 school year, only 43% of 6th grade applications to Pershing, and 41% for Meyerland, were considered “qualified.” That means that more than half of these applicants were not considered “qualified” by the judges of their auditions.
The data that General Academic received from HISD showed that Meyerland Middle School had 616 open seats for 6th grade this past cycle, which is misleading. The official count takes into account a theoretical maximum number of available seats for each of 11 arts disciplines and doubles them since students must apply to two disciplines. Therefore, the actual number of available seats is over 22x less than the official number shown, which explains why only 41% (562) of applications were considered “qualified.”
Houston Families Want Alternatives for Middle School

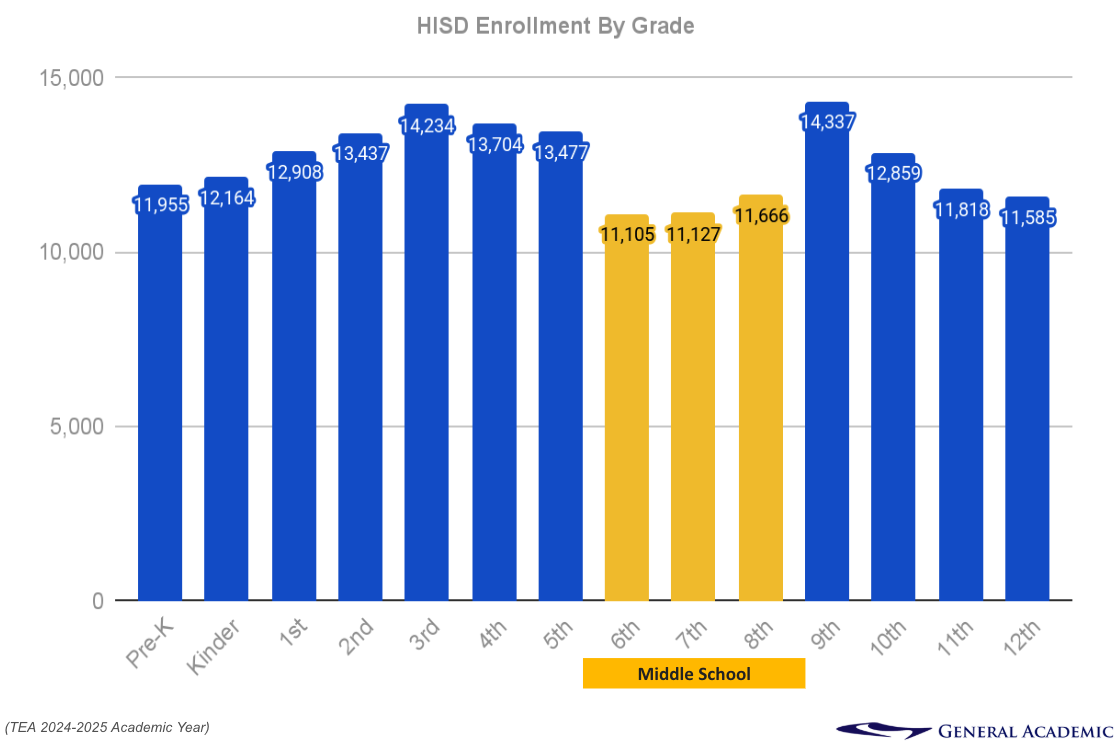
According to TEA enrollment data for both 2023–2024 and 2024–2025, HISD lost about 20% of students making the transition from 5th grade elementary to 6th grade middle school as seemingly dissatisfied families left the district for suburban, private, or charter school alternatives.
Instead of sending their children to HISD middle schools, parents increasingly opt for one of two options: private schools or charter schools.
Publicly funded charter schools in Houston have been particularly appealing to families unable or unwilling to pay for private schools, and these schools are expanding rapidly. According to the Texas Education Agency, enrollment in charter schools across the state has nearly doubled over the decade, to the point where nearly 8% of all Texas public school students are enrolled in charter schools, which disproportionately serve economically disadvantaged students.
This influx is especially relevant to charter middle schools, which have consistently shown the highest level of enrollment, more than both elementary and high schools. For parents of students entering middle school, the specialized programs, unique cultures, and perceived opportunities for success of charter schools serve as a significant pull factor away from HISD middle schools.
Meanwhile, many affluent families who were previously happy with their neighborhood elementary schools are not enthusiastic about attending much larger middle schools and often consider making the switch to private schools starting at 6th grade.
The middle school years are a critical, transitional period in a student’s academic journey. Historically, the percentage of HISD students considered at-risk increases from elementary to middle school. This year, however, data from Children at Risk shows that 76% of elementary-aged students are considered at-risk versus 71% for middle schoolers. Charter and private schools are successfully siphoning off a significant portion of potential HISD middle school enrollees, thereby disproportionately affecting the district’s middle school population and the funding that comes with them.
Top Houston ISD (HISD) Magnet High Schools for 2024-2025
The top three Houston ISD high schools are DeBakey, Carnegie Vanguard, and Bellaire.
For students applying for the 2025-2026 academic year, 4,412 students submitted 12,666 ninth grade applications to 58 HISD high school programs, which represents a 16% decrease versus two years ago. Rising 9th graders applied to an average of 2.9 programs each. Ninth grade is the “prime entry” year for most HISD high schools.

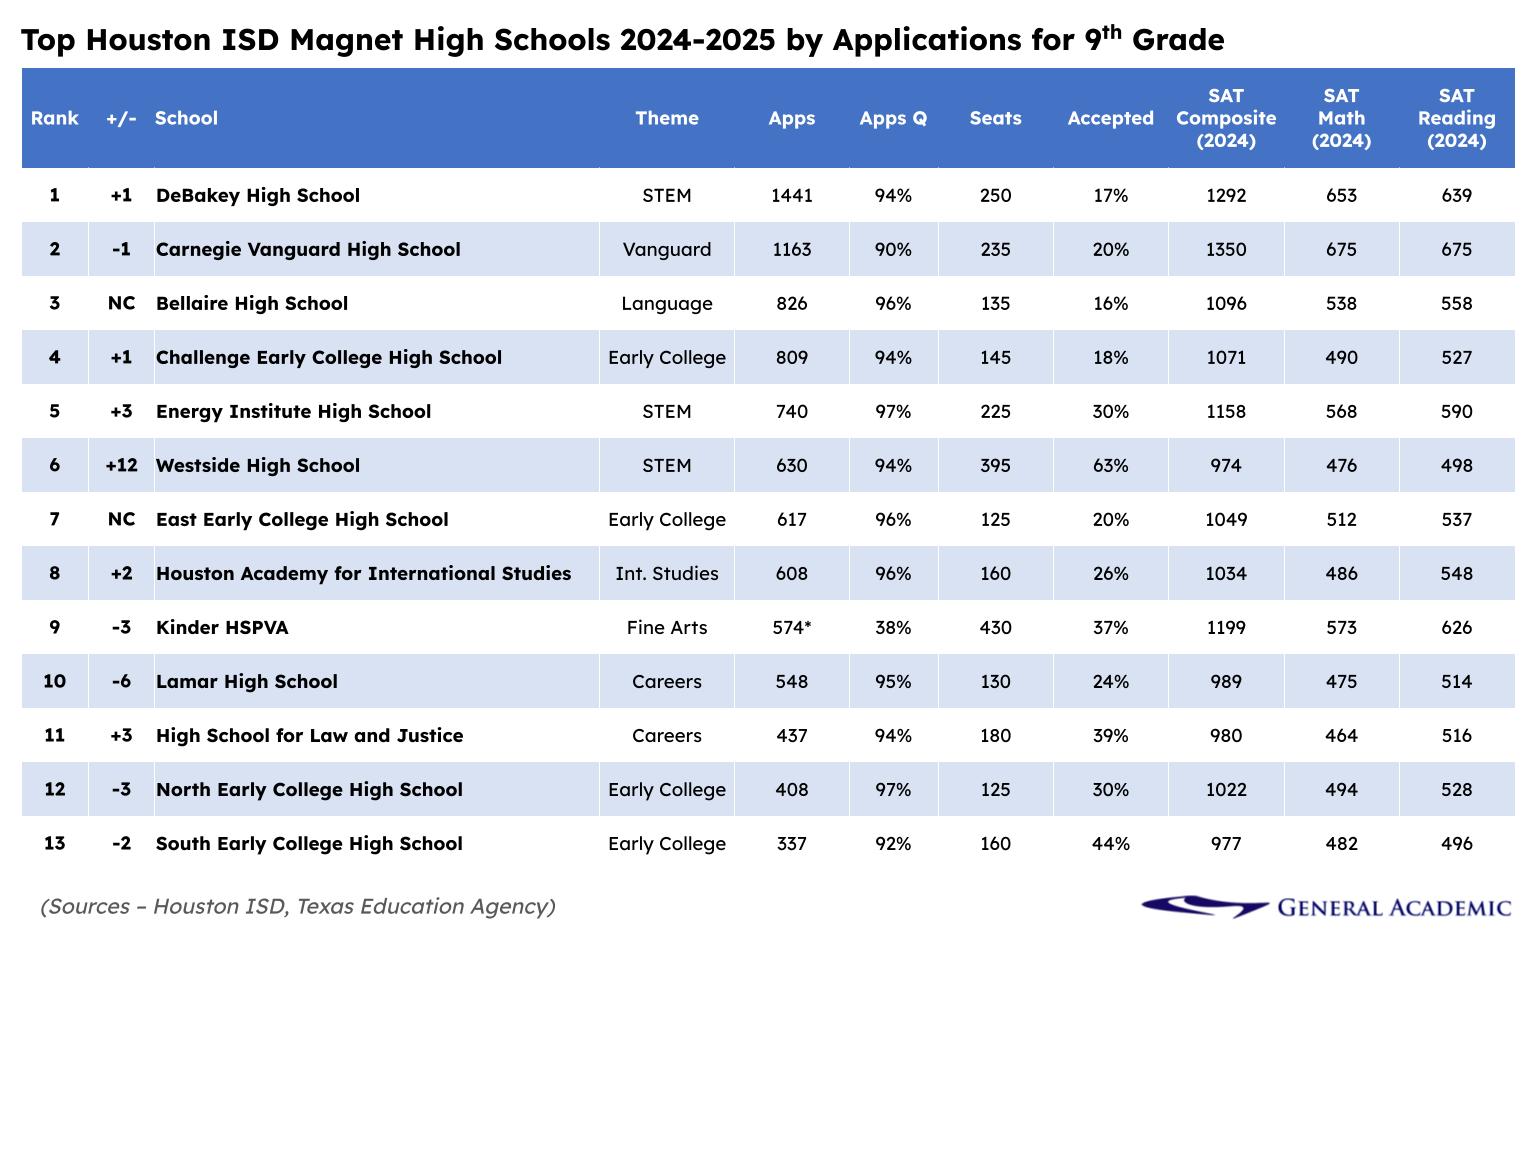
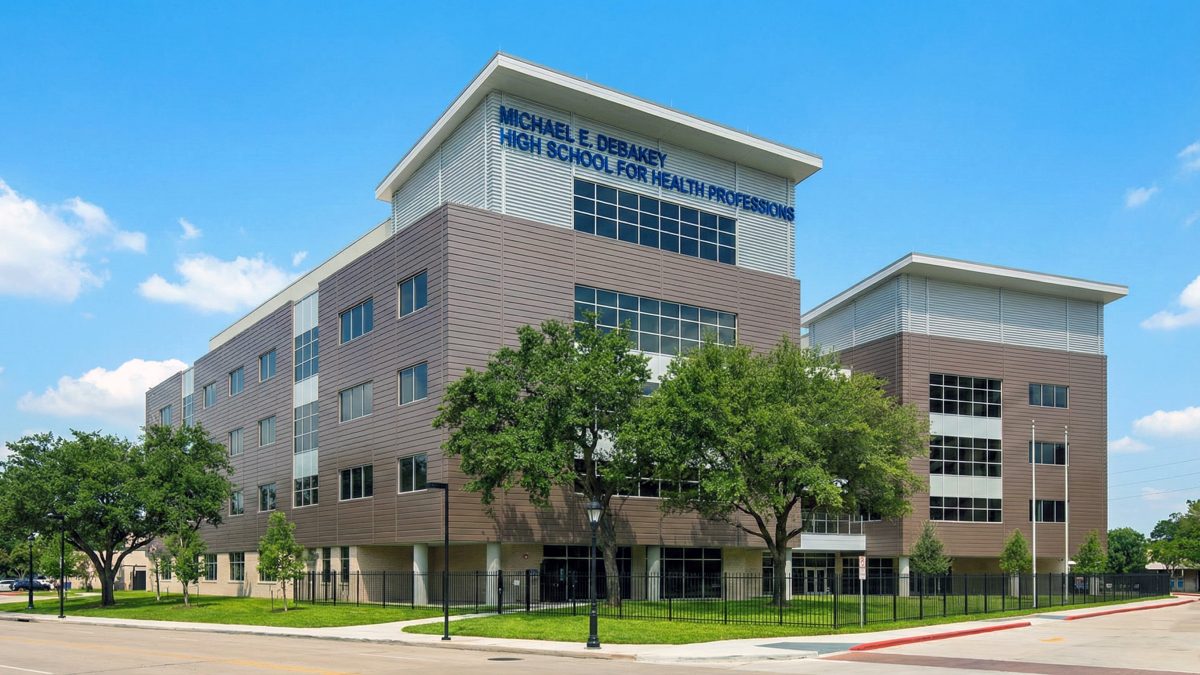
DeBakey and Carnegie Vanguard are HISD’s top high schools by applications, academic results, and national recognition. US News ranks DeBakey #75 and Carnegie #42 nationally. As such, it’s no surprise they’re so popular among Houston families. Both schools are great choices, and qualified students had around a 17% chance of getting into DeBakey in the Medical Center and 20% for Carnegie nestled in Fourth Ward.
With Houston being home of the world’s largest medical center, it’s no surprise that DeBakey has risen to the #1 spot for receiving the most magnet applications. Debakey is an application-only magnet school. This means all 100% of ninth grade seats were available to lottery students as there is no zoned, neighborhood population. Designed for students interested in becoming physicians, applicants must demonstrate strong academic performance in STEM courses. DeBakey received 1,441 ninth grade applications, and 94% of these applicants qualified. With only 250 seats available, there was only a 17% chance of admission in the general ninth grade lottery. Paired with its academically rigorous curriculum, DeBakey’s Medical Center campus provides students with early access to career exploration in health sciences.
Some HISD magnet schools deliver rigor through a specialized focus, such as medicine, while others—like Carnegie Vanguard—provide rigor through an accelerated, broad Gifted/Talented curriculum. Carnegie Vanguard received 1,163 ninth grade applications, and 90% of those students were qualified, meaning that only 10% of applications lacked the gifted and talented designation. All 100% of Carnegie’s 9th grade seats were available to lottery students as there is no zoned, neighborhood population. Just 23% of qualified applicants received an offer of admission, and nearly all of these offers were happily accepted.
The average composite SAT score among DeBakey in 2025 was 1292, which easily places the average DeBakey student in the top 13% of students nationally. With an average composite score of 1350, students at Carnegie place in the top 10% on average, on par with elite private schools like Kinkaid. Nearly every HISD junior is required to take the SAT in-class in the spring.
As Houston’s premier magnet school for the arts, Kinder High School for the Performing and Visual Arts (HSPVA) deserves to be mentioned in the same breath as DeBakey and Carnegie. Similar to Meyerland Middle School, its lower rank among the top schools is the result of imprecise data from HISD and its more limited appeal to extraordinarily talented students. By SAT scores, HSPVA is third only behind DeBakey.
Early College Schools Remain Popular
Houston’s Early College high schools are increasingly earning their place among the district’s elite offerings. These high schools are unique in that graduating students earn not only a high school diploma but also a college associate’s degree, which is a 2-year counterpart to the 4-year bachelor’s degree. Ideally, graduates would then use this 2-year degree as a way to get a jump start on their college bachelor’s degree.
Popular schools like Challenge, East, and North Early College High Schools stand out for their high STAAR math scores but aren’t quite delivering when it comes to SAT scores, which remain below large schools like Bellaire.
Although HISD’s comparatively wide selection of top high schools helps bring families back into public education, it still isn’t doing enough to retain its most vulnerable students. Nearly 13% of freshmen will not make it through senior year, which compares unfavorably to the state public school average of 10% pre-COVID.
Dataset for all Houston ISD Magnet Schools
| Program | Grade Level | Phase 1 Apps | Silbling Apps | Qualified Apps | Seats Available | % Accepted |
|---|---|---|---|---|---|---|
| Arabic Immersion Magnet School: Language Immersion | K | 71 | 1 | 71 | 15 | 11% |
| Arabic Immersion Magnet School: Language Immersion | 1 | 26 | 0 | 26 | 20 | 46% |
| Arabic Immersion Magnet School: Language Immersion | 2 | 20 | 0 | 20 | 17 | 40% |
| Arabic Immersion Magnet School: Language Immersion | 3 | 14 | 0 | 14 | 0 | 0% |
| Arabic Immersion Magnet School: Language Immersion | 4 | 16 | 0 | 16 | 9 | 44% |
| Arabic Immersion Magnet School: Language Immersion | 5 | 10 | 0 | 10 | 10 | 20% |
| Arabic Immersion Magnet School: Language Immersion | 6 | 42 | 1 | 42 | 30 | 14% |
| Arabic Immersion Magnet School: Language Immersion | 7 | 6 | 0 | 6 | 0 | 0% |
| Arabic Immersion Magnet School: Language Immersion | 8 | 1 | 0 | 1 | 0 | 0% |
| Askew ES: Vanguard (Gifted and Talented) | K | 11 | 0 | 8 | 65 | 0% |
| Askew ES: Vanguard (Gifted and Talented) | 1 | 7 | 0 | 4 | 45 | 29% |
| Askew ES: Vanguard (Gifted and Talented) | 2 | 4 | 0 | 3 | 45 | 0% |
| Askew ES: Vanguard (Gifted and Talented) | 3 | 4 | 0 | 4 | 43 | 50% |
| Askew ES: Vanguard (Gifted and Talented) | 4 | 5 | 0 | 5 | 37 | 60% |
| Askew ES: Vanguard (Gifted and Talented) | 5 | 4 | 0 | 4 | 45 | 0% |
| Atherton ES: Fine Arts | K | 2 | 0 | 2 | 25 | 0% |
| Atherton ES: Fine Arts | 1 | 1 | 0 | 1 | 15 | 0% |
| Atherton ES: Fine Arts | 2 | 0 | 0 | 0 | 15 | 0% |
| Atherton ES: Fine Arts | 3 | 1 | 0 | 1 | 15 | 0% |
| Atherton ES: Fine Arts | 4 | 0 | 0 | 0 | 15 | 0% |
| Atherton ES: Fine Arts | 5 | 0 | 0 | 0 | 15 | 0% |
| Attucks MS: STEAM | 6 | 23 | 0 | 23 | 180 | 0% |
| Attucks MS: STEAM | 7 | 4 | 0 | 4 | 175 | 0% |
| Attucks MS: STEAM | 8 | 5 | 0 | 5 | 0 | 0% |
| Austin HS: Maritime Academy | 9 | 37 | 1 | 37 | 150 | 19% |
| Austin HS: Maritime Academy | 10 | 1 | 0 | 1 | 150 | 0% |
| Austin HS: Teaching Professions | 9 | 36 | 1 | 35 | 145 | 3% |
| Austin HS: Teaching Professions | 10 | 5 | 0 | 5 | 145 | 40% |
| Baker Montessori | K | 233 | 0 | 233 | 60 | 13% |
| Baker Montessori | 1 | 77 | 0 | 77 | 29 | 12% |
| Baker Montessori | 2 | 35 | 0 | 32 | 17 | 9% |
| Baker Montessori | 3 | 11 | 0 | 6 | 15 | 0% |
| Baker Montessori | 4 | 12 | 0 | 5 | 10 | 0% |
| Baker Montessori | 5 | 9 | 0 | 3 | 10 | 0% |
| Baker Montessori | 6 | 49 | 0 | 38 | 0 | 63% |
| Baker Montessori | 7 | 4 | 0 | 3 | 0 | 0% |
| Baker Montessori | 8 | 2 | 0 | 0 | 7 | 0% |
| Baylor College Of Medicine Acd at Ryan: S.T.E.M - Health Sciences | 6 | 319 | 0 | 319 | 225 | 22% |
| Baylor College Of Medicine Acd at Ryan: S.T.E.M - Health Sciences | 7 | 47 | 0 | 47 | 50 | 2% |
| Baylor College Of Medicine Acd at Ryan: S.T.E.M - Health Sciences | 8 | 31 | 0 | 31 | 0 | 0% |
| Baylor College of Medicine Biotech Academy at Rusk: Health Sciences | 6 | 317 | 0 | 317 | 150 | 31% |
| Baylor College of Medicine Biotech Academy at Rusk: Health Sciences | 7 | 30 | 0 | 30 | 25 | 20% |
| Baylor College of Medicine Biotech Academy at Rusk: Health Sciences | 8 | 16 | 0 | 16 | 30 | 50% |
| Bell ES: Physical Development | K | 8 | 0 | 8 | 25 | 13% |
| Bell ES: Physical Development | 1 | 2 | 0 | 2 | 10 | 0% |
| Bell ES: Physical Development | 2 | 2 | 0 | 2 | 4 | 0% |
| Bell ES: Physical Development | 3 | 2 | 0 | 2 | 4 | 50% |
| Bell ES: Physical Development | 4 | 2 | 0 | 2 | 5 | 0% |
| Bell ES: Physical Development | 5 | 1 | 0 | 1 | 12 | 0% |
| Bellaire HS: World Languages | 9 | 826 | 6 | 793 | 135 | 12% |
| Berry ES: Environmental Science | K | 27 | 0 | 27 | 60 | 104% |
| Berry ES: Environmental Science | 1 | 0 | 0 | 0 | 35 | 0% |
| Berry ES: Environmental Science | 2 | 4 | 0 | 4 | 10 | 75% |
| Berry ES: Environmental Science | 3 | 2 | 0 | 2 | 10 | 150% |
| Berry ES: Environmental Science | 4 | 4 | 0 | 4 | 10 | 0% |
| Berry ES: Environmental Science | 5 | 3 | 0 | 3 | 10 | 67% |
| Black MS: Vanguard (Gifted and Talented) | 6 | 222 | 7 | 203 | 320 | 36% |
| Black MS: Vanguard (Gifted and Talented) | 7 | 24 | 0 | 19 | 40 | 33% |
| Black MS: Vanguard (Gifted and Talented) | 8 | 10 | 0 | 7 | 40 | 30% |
| Blackshear ES: Montessori | K | 14 | 0 | 14 | 40 | 29% |
| Blackshear ES: Montessori | 1 | 8 | 0 | 8 | 28 | 25% |
| Blackshear ES: Montessori | 2 | 1 | 0 | 1 | 25 | 0% |
| Blackshear ES: Montessori | 3 | 0 | 0 | 0 | 5 | 0% |
| Blackshear ES: Montessori | 4 | 2 | 0 | 2 | 6 | 50% |
| Blackshear ES: Montessori | 5 | 0 | 0 | 0 | 5 | 0% |
| Bruce ES: Music | K | 4 | 0 | 4 | 188 | 25% |
| Bruce ES: Music | 1 | 1 | 0 | 1 | 107 | 0% |
| Bruce ES: Music | 2 | 0 | 0 | 0 | 103 | 0% |
| Bruce ES: Music | 3 | 0 | 0 | 0 | 122 | 0% |
| Bruce ES: Music | 4 | 0 | 0 | 0 | 122 | 0% |
| Bruce ES: Music | 5 | 1 | 0 | 1 | 122 | 0% |
| Burbank ES | K | 0 | 0 | 0 | 0 | 0% |
| Burbank ES | 1 | 0 | 0 | 0 | 0 | 0% |
| Burbank ES | 2 | 0 | 0 | 0 | 0 | 0% |
| Burbank ES | 3 | 0 | 0 | 0 | 0 | 0% |
| Burbank ES | 4 | 0 | 0 | 0 | 0 | 0% |
| Burbank ES | 5 | 0 | 0 | 0 | 0 | 0% |
| Burbank ES: Fine Arts | K | 37 | 0 | 37 | 0 | 57% |
| Burbank ES: Fine Arts | 1 | 10 | 0 | 10 | 20 | 30% |
| Burbank ES: Fine Arts | 2 | 6 | 0 | 6 | 12 | 33% |
| Burbank ES: Fine Arts | 3 | 5 | 0 | 5 | 5 | 60% |
| Burbank ES: Fine Arts | 4 | 5 | 0 | 5 | 5 | 40% |
| Burbank ES: Fine Arts | 5 | 2 | 0 | 2 | 5 | 100% |
| Burbank MS: Vanguard (Gifted and Talented) | 6 | 108 | 6 | 95 | 400 | 33% |
| Burbank MS: Vanguard (Gifted and Talented) | 7 | 10 | 0 | 9 | 60 | 70% |
| Burbank MS: Vanguard (Gifted and Talented) | 8 | 6 | 0 | 4 | 40 | 33% |
| Burrus ES: Fine Arts | K | 9 | 0 | 9 | 8 | 11% |
| Burrus ES: Fine Arts | 1 | 0 | 0 | 0 | 19 | 0% |
| Burrus ES: Fine Arts | 2 | 0 | 0 | 0 | 8 | 0% |
| Burrus ES: Fine Arts | 3 | 0 | 0 | 0 | 18 | 0% |
| Burrus ES: Fine Arts | 4 | 0 | 0 | 0 | 15 | 0% |
| Burrus ES: Fine Arts | 5 | 3 | 0 | 3 | 12 | 0% |
| Carnegie Vanguard HS: Vanguard (Gifted and Talented) | 9 | 1,163 | 7 | 1,042 | 235 | 16% |
| Carnegie Vanguard HS: Vanguard (Gifted and Talented) | 10 | 102 | 0 | 85 | 15 | 8% |
| Carrillo ES: Vanguard (Gifted and Talented) | K | 10 | 0 | 5 | 40 | 0% |
| Carrillo ES: Vanguard (Gifted and Talented) | 1 | 1 | 0 | 1 | 20 | 0% |
| Carrillo ES: Vanguard (Gifted and Talented) | 2 | 2 | 0 | 2 | 20 | 50% |
| Carrillo ES: Vanguard (Gifted and Talented) | 3 | 2 | 0 | 2 | 20 | 0% |
| Carrillo ES: Vanguard (Gifted and Talented) | 4 | 1 | 0 | 1 | 20 | 100% |
| Carrillo ES: Vanguard (Gifted and Talented) | 5 | 0 | 0 | 0 | 20 | 0% |
| Challenge Early College HS: Early College | 9 | 809 | 10 | 757 | 145 | 13% |
| Challenge Early College HS: Early College | 10 | 0 | 0 | 0 | 0 | 0% |
| Chavez HS - Engineering | 9 | 38 | 0 | 37 | 200 | 5% |
| Chavez HS - Engineering | 10 | 4 | 0 | 4 | 80 | 50% |
| Chavez HS - Engineering | 11 | 4 | 0 | 3 | 40 | 25% |
| Chavez HS - Engineering | 12 | 0 | 0 | 0 | 40 | 0% |
| Chavez HS - Environmental Science | 9 | 4 | 0 | 4 | 200 | 25% |
| Chavez HS - Environmental Science | 10 | 0 | 0 | 0 | 80 | 0% |
| Chavez HS - Environmental Science | 11 | 0 | 0 | 0 | 25 | 0% |
| Chavez HS - Environmental Science | 12 | 0 | 0 | 0 | 25 | 0% |
| Chavez HS - Health Science | 9 | 14 | 0 | 14 | 200 | 43% |
| Chavez HS - Health Science | 10 | 1 | 0 | 1 | 80 | 0% |
| Chavez HS - Health Science | 11 | 0 | 0 | 0 | 40 | 0% |
| Chavez HS - Health Science | 12 | 0 | 0 | 0 | 40 | 0% |
| Chavez HS - Vamos (Video/Audio/Media/Occupational Studies) | 9 | 7 | 0 | 7 | 200 | 14% |
| Chavez HS - Vamos (Video/Audio/Media/Occupational Studies) | 10 | 0 | 0 | 0 | 80 | 0% |
| Chavez HS - Vamos (Video/Audio/Media/Occupational Studies) | 11 | 0 | 0 | 0 | 40 | 0% |
| Chavez HS - Vamos (Video/Audio/Media/Occupational Studies) | 12 | 0 | 0 | 0 | 40 | 0% |
| Clifton MS: STEM | 6 | 22 | 0 | 22 | 40 | 9% |
| Clifton MS: STEM | 7 | 5 | 0 | 5 | 40 | 20% |
| Clifton MS: STEM | 8 | 0 | 0 | 0 | 40 | 0% |
| Codwell ES: Fine Arts | K | 19 | 0 | 19 | 25 | 21% |
| Codwell ES: Fine Arts | 1 | 3 | 0 | 3 | 13 | 33% |
| Codwell ES: Fine Arts | 2 | 2 | 0 | 2 | 15 | 100% |
| Codwell ES: Fine Arts | 3 | 4 | 0 | 4 | 23 | 0% |
| Codwell ES: Fine Arts | 4 | 2 | 0 | 2 | 20 | 0% |
| Codwell ES: Fine Arts | 5 | 7 | 0 | 7 | 12 | 0% |
| Cook JR ES: Fine Arts | K | 3 | 0 | 3 | 10 | 33% |
| Cook JR ES: Fine Arts | 1 | 0 | 0 | 0 | 5 | 0% |
| Cook JR ES: Fine Arts | 2 | 1 | 0 | 1 | 5 | 100% |
| Cook JR ES: Fine Arts | 3 | 1 | 0 | 1 | 12 | 100% |
| Cook JR ES: Fine Arts | 4 | 0 | 0 | 0 | 5 | 0% |
| Cook JR ES: Fine Arts | 5 | 0 | 0 | 0 | 3 | 0% |
| Cornelius ES: Math and Science | K | 45 | 0 | 45 | 75 | 51% |
| Cornelius ES: Math and Science | 1 | 19 | 0 | 19 | 8 | 26% |
| Cornelius ES: Math and Science | 2 | 9 | 0 | 9 | 5 | 44% |
| Cornelius ES: Math and Science | 3 | 7 | 0 | 7 | 23 | 43% |
| Cornelius ES: Math and Science | 4 | 3 | 0 | 3 | 2 | 33% |
| Cornelius ES: Math and Science | 5 | 6 | 0 | 6 | 0 | 0% |
| Crespo ES: Fine Arts | K | 24 | 0 | 24 | 35 | 88% |
| Crespo ES: Fine Arts | 1 | 4 | 0 | 4 | 10 | 50% |
| Crespo ES: Fine Arts | 2 | 3 | 0 | 3 | 10 | 0% |
| Crespo ES: Fine Arts | 3 | 2 | 0 | 2 | 20 | 50% |
| Crespo ES: Fine Arts | 4 | 0 | 0 | 0 | 15 | 0% |
| Crespo ES: Fine Arts | 5 | 6 | 0 | 6 | 15 | 17% |
| Crockett ES: Performing and Visual Arts | K | 58 | 3 | 58 | 60 | 64% |
| Crockett ES: Performing and Visual Arts | 1 | 17 | 0 | 17 | 10 | 6% |
| Crockett ES: Performing and Visual Arts | 2 | 9 | 0 | 9 | 20 | 33% |
| Crockett ES: Performing and Visual Arts | 3 | 12 | 0 | 12 | 20 | 42% |
| Crockett ES: Performing and Visual Arts | 4 | 11 | 0 | 11 | 5 | 36% |
| Crockett ES: Performing and Visual Arts | 5 | 9 | 0 | 9 | 0 | 0% |
| Davila ES: Aerospace and Engineering | K | 23 | 0 | 23 | 25 | 39% |
| Davila ES: Aerospace and Engineering | 1 | 3 | 0 | 3 | 15 | 0% |
| Davila ES: Aerospace and Engineering | 2 | 4 | 0 | 4 | 15 | 50% |
| Davila ES: Aerospace and Engineering | 3 | 2 | 0 | 2 | 15 | 50% |
| Davila ES: Aerospace and Engineering | 4 | 2 | 0 | 2 | 15 | 100% |
| Davila ES: Aerospace and Engineering | 5 | 3 | 0 | 3 | 15 | 0% |
| Deady Middle School: Aerospace and Engineering | 6 | 29 | 0 | 29 | 75 | 7% |
| Deady Middle School: Aerospace and Engineering | 7 | 8 | 0 | 8 | 75 | 13% |
| Deady Middle School: Aerospace and Engineering | 8 | 2 | 0 | 2 | 75 | 50% |
| DeBakey HSHP: Health Professions | 9 | 1,441 | 18 | 1,360 | 250 | 13% |
| DeZavala Elementary: Vanguard (Gifted and Talented) | K | 2 | 0 | 1 | 79 | 0% |
| DeZavala Elementary: Vanguard (Gifted and Talented) | 1 | 1 | 0 | 1 | 79 | 100% |
| DeZavala Elementary: Vanguard (Gifted and Talented) | 2 | 1 | 0 | 1 | 79 | 0% |
| DeZavala Elementary: Vanguard (Gifted and Talented) | 3 | 1 | 0 | 1 | 79 | 0% |
| DeZavala Elementary: Vanguard (Gifted and Talented) | 4 | 1 | 0 | 1 | 79 | 0% |
| DeZavala Elementary: Vanguard (Gifted and Talented) | 5 | 1 | 0 | 1 | 79 | 100% |
| Durham Elementary: IB: Primary Years Programme | K | 105 | 0 | 105 | 73 | 28% |
| Durham Elementary: IB: Primary Years Programme | 1 | 14 | 0 | 14 | 20 | 7% |
| Durham Elementary: IB: Primary Years Programme | 2 | 10 | 0 | 10 | 30 | 40% |
| Durham Elementary: IB: Primary Years Programme | 3 | 12 | 0 | 12 | 14 | 17% |
| Durham Elementary: IB: Primary Years Programme | 4 | 13 | 0 | 13 | 2 | 0% |
| Durham Elementary: IB: Primary Years Programme | 5 | 9 | 0 | 9 | 14 | 33% |
| East Early College HS: Early College High School | 9 | 617 | 6 | 591 | 125 | 17% |
| East Early College HS: Early College High School | 10 | 55 | 0 | 51 | 8 | 9% |
| East Early College HS: Early College High School | 11 | 50 | 0 | 43 | 5 | 6% |
| Elrod Elementary: Emerging Medical Scholars | K | 20 | 0 | 20 | 10 | 30% |
| Elrod Elementary: Emerging Medical Scholars | 1 | 10 | 0 | 10 | 1 | 0% |
| Elrod Elementary: Emerging Medical Scholars | 2 | 8 | 0 | 8 | 11 | 13% |
| Elrod Elementary: Emerging Medical Scholars | 3 | 2 | 0 | 2 | 1 | 0% |
| Elrod Elementary: Emerging Medical Scholars | 4 | 7 | 0 | 7 | 11 | 0% |
| Elrod Elementary: Emerging Medical Scholars | 5 | 4 | 0 | 4 | 11 | 25% |
| Energy Institute High School: STEM | 9 | 740 | 9 | 721 | 225 | 22% |
| Energy Institute High School: STEM | 10 | 56 | 0 | 49 | 40 | 39% |
| Energy Institute High School: STEM | 11 | 30 | 0 | 26 | 15 | 43% |
| Fleming Middle School: Fine Arts | 6 | 8 | 0 | 8 | 160 | 0% |
| Fleming Middle School: Fine Arts | 7 | 3 | 0 | 2 | 160 | 0% |
| Fleming Middle School: Fine Arts | 8 | 1 | 0 | 1 | 160 | 0% |
| Fondren Middle School: IB: Middle Years Programme | 6 | 0 | 0 | 0 | 149 | 0% |
| Fondren Middle School: IB: Middle Years Programme | 7 | 0 | 0 | 0 | 150 | 0% |
| Fondren Middle School: IB: Middle Years Programme | 8 | 0 | 0 | 0 | 150 | 0% |
| Fonville Middle School: STEM | 6 | 19 | 0 | 19 | 450 | 11% |
| Fonville Middle School: STEM | 7 | 29 | 0 | 29 | 300 | 97% |
| Furr High School: Green Institute - S.T.E.M. | 9 | 46 | 4 | 40 | 130 | 17% |
| Furr High School: Green Institute - S.T.E.M. | 10 | 9 | 0 | 7 | 120 | 0% |
| Furr High School: Green Institute - S.T.E.M. | 11 | 6 | 0 | 4 | 100 | 0% |
| Furr High School: Green Institute - S.T.E.M. | 12 | 1 | 0 | 1 | 0 | 0% |
| Garden Oaks Montessori | K | 233 | 1 | 233 | 18 | 6% |
| Garden Oaks Montessori | 1 | 43 | 0 | 43 | 2 | 0% |
| Garden Oaks Montessori | 2 | 15 | 0 | 13 | 2 | 13% |
| Garden Oaks Montessori | 3 | 11 | 0 | 9 | 0 | 0% |
| Garden Oaks Montessori | 4 | 10 | 0 | 8 | 0 | 0% |
| Garden Oaks Montessori | 5 | 12 | 0 | 8 | 0 | 0% |
| Garden Oaks Montessori | 6 | 72 | 0 | 63 | 0 | 56% |
| Garden Oaks Montessori | 7 | 11 | 0 | 8 | 0 | 0% |
| Garden Oaks Montessori | 8 | 3 | 0 | 2 | 0 | 0% |
| Garden Villas Elementary: Music | K | 12 | 0 | 12 | 80 | 0% |
| Garden Villas Elementary: Music | 1 | 1 | 0 | 1 | 80 | 0% |
| Garden Villas Elementary: Music | 2 | 2 | 0 | 2 | 80 | 0% |
| Garden Villas Elementary: Music | 3 | 6 | 0 | 6 | 55 | 0% |
| Garden Villas Elementary: Music | 4 | 4 | 0 | 4 | 55 | 0% |
| Garden Villas Elementary: Music | 5 | 7 | 0 | 7 | 55 | 0% |
| Gregory-Lincoln Ed Ctr: Fine Arts | K | 7 | 0 | 7 | 34 | 14% |
| Gregory-Lincoln Ed Ctr: Fine Arts | 1 | 4 | 0 | 4 | 38 | 25% |
| Gregory-Lincoln Ed Ctr: Fine Arts | 2 | 0 | 0 | 0 | 38 | 0% |
| Gregory-Lincoln Ed Ctr: Fine Arts | 3 | 1 | 0 | 1 | 38 | 0% |
| Gregory-Lincoln Ed Ctr: Fine Arts | 4 | 0 | 0 | 0 | 38 | 0% |
| Gregory-Lincoln Ed Ctr: Fine Arts | 5 | 0 | 0 | 0 | 42 | 0% |
| Gregory-Lincoln Ed Ctr: Fine Arts | 6 | 35 | 0 | 35 | 50 | 3% |
| Gregory-Lincoln Ed Ctr: Fine Arts | 7 | 7 | 0 | 7 | 46 | 14% |
| Gregory-Lincoln Ed Ctr: Fine Arts | 8 | 2 | 0 | 2 | 46 | 0% |
| Hamilton Middle School: Vanguard (Gifted and Talented) | 6 | 219 | 3 | 192 | 400 | 21% |
| Hamilton Middle School: Vanguard (Gifted and Talented) | 7 | 26 | 0 | 19 | 20 | 15% |
| Hamilton Middle School: Vanguard (Gifted and Talented) | 8 | 13 | 0 | 11 | 50 | 15% |
| Hartman Middle School: STEM Medical and Health Science | 6 | 53 | 0 | 53 | 300 | 15% |
| Hartman Middle School: STEM Medical and Health Science | 7 | 6 | 0 | 6 | 200 | 50% |
| Hartman Middle School: STEM Medical and Health Science | 8 | 7 | 0 | 7 | 125 | 57% |
| Hartsfield Elementary: Animal and Environmental Sciences | K | 11 | 0 | 11 | 54 | 0% |
| Hartsfield Elementary: Animal and Environmental Sciences | 1 | 2 | 0 | 2 | 47 | 50% |
| Hartsfield Elementary: Animal and Environmental Sciences | 2 | 2 | 0 | 2 | 75 | 0% |
| Hartsfield Elementary: Animal and Environmental Sciences | 3 | 0 | 0 | 0 | 48 | 0% |
| Hartsfield Elementary: Animal and Environmental Sciences | 4 | 3 | 0 | 3 | 40 | 0% |
| Hartsfield Elementary: Animal and Environmental Sciences | 5 | 4 | 0 | 4 | 54 | 0% |
| Harvard Elementary: STEM | K | 369 | 0 | 369 | 40 | 10% |
| Harvard Elementary: STEM | 1 | 79 | 0 | 79 | 10 | 10% |
| Harvard Elementary: STEM | 2 | 53 | 0 | 53 | 10 | 11% |
| Harvard Elementary: STEM | 3 | 54 | 0 | 54 | 20 | 22% |
| Harvard Elementary: STEM | 4 | 48 | 0 | 48 | 20 | 19% |
| Harvard Elementary: STEM | 5 | 0 | 0 | 0 | 0 | 0% |
| Heights High School - Magnet A/V Production | 9 | 211 | 3 | 202 | 115 | 46% |
| Heights High School - Magnet A/V Production | 10 | 0 | 0 | 0 | 0 | 0% |
| Heights High School - Magnet Digital Media & Web Design | 9 | 295 | 7 | 282 | 115 | 29% |
| Heights High School - Magnet Digital Media & Web Design | 10 | 0 | 0 | 0 | 0 | 0% |
| Helms Elementary: Dual Language | K | 158 | 0 | 158 | 44 | 15% |
| Helms Elementary: Dual Language | 1 | 32 | 0 | 32 | 4 | 3% |
| Helms Elementary: Dual Language | 2 | 15 | 0 | 15 | 5 | 0% |
| Helms Elementary: Dual Language | 3 | 0 | 0 | 0 | 0 | 0% |
| Helms Elementary: Dual Language | 4 | 16 | 0 | 16 | 4 | 0% |
| Helms Elementary: Dual Language | 5 | 6 | 0 | 6 | 5 | 0% |
| Henry Middle School Medical Careers | 6 | 20 | 0 | 20 | 200 | 0% |
| Henry Middle School Medical Careers | 7 | 3 | 0 | 3 | 0 | 0% |
| Henry Middle School Medical Careers | 8 | 2 | 0 | 2 | 0 | 0% |
| Herod Elementary: Vanguard (Gifted and Talented) | K | 23 | 0 | 12 | 48 | 4% |
| Herod Elementary: Vanguard (Gifted and Talented) | 1 | 4 | 0 | 3 | 8 | 25% |
| Herod Elementary: Vanguard (Gifted and Talented) | 2 | 8 | 0 | 6 | 8 | 25% |
| Herod Elementary: Vanguard (Gifted and Talented) | 3 | 4 | 0 | 4 | 5 | 0% |
| Herod Elementary: Vanguard (Gifted and Talented) | 4 | 12 | 0 | 10 | 5 | 8% |
| Herod Elementary: Vanguard (Gifted and Talented) | 5 | 5 | 0 | 3 | 6 | 0% |
| Herrera Elementary: Integrated Technology | K | 19 | 2 | 19 | 15 | 37% |
| Herrera Elementary: Integrated Technology | 1 | 8 | 0 | 8 | 10 | 0% |
| Herrera Elementary: Integrated Technology | 2 | 6 | 0 | 6 | 14 | 33% |
| Herrera Elementary: Integrated Technology | 3 | 9 | 0 | 9 | 15 | 44% |
| Herrera Elementary: Integrated Technology | 4 | 6 | 0 | 6 | 10 | 67% |
| Herrera Elementary: Integrated Technology | 5 | 4 | 0 | 4 | 10 | 25% |
| Hogg Middle School: STEM | 6 | 884 | 25 | 884 | 375 | 24% |
| Hogg Middle School: STEM | 7 | 106 | 0 | 106 | 25 | 8% |
| Hogg Middle School: STEM | 8 | 44 | 0 | 44 | 25 | 18% |
| Houston Academy for International Studies: Early College High School | 9 | 608 | 6 | 582 | 160 | 18% |
| Houston Academy for International Studies: Early College High School | 10 | 54 | 0 | 49 | 30 | 20% |
| Houston Academy for International Studies: Early College High School | 11 | 0 | 0 | 0 | 0 | 0% |
| Houston Academy for International Studies: Early College High School | 12 | 0 | 0 | 0 | 0 | 0% |
| Kashmere Gardens Elementary: Fine Arts | K | 2 | 0 | 2 | 10 | 0% |
| Kashmere Gardens Elementary: Fine Arts | 1 | 0 | 0 | 0 | 10 | 0% |
| Kashmere Gardens Elementary: Fine Arts | 2 | 1 | 0 | 1 | 10 | 0% |
| Kashmere Gardens Elementary: Fine Arts | 3 | 2 | 0 | 2 | 10 | 0% |
| Kashmere Gardens Elementary: Fine Arts | 4 | 1 | 0 | 1 | 10 | 0% |
| Kashmere Gardens Elementary: Fine Arts | 5 | 0 | 0 | 0 | 10 | 0% |
| Kashmere High School: Performing & Visual Arts | 9 | 33 | 0 | 31 | 166 | 0% |
| Kashmere High School: Performing & Visual Arts | 10 | 11 | 0 | 11 | 148 | 0% |
| Kashmere High School: Performing & Visual Arts | 11 | 4 | 0 | 4 | 155 | 0% |
| Kashmere High School: Performing & Visual Arts | 12 | 3 | 0 | 3 | 155 | 67% |
| Kashmere High School: STEM | 9 | 12 | 0 | 12 | 0 | 0% |
| Kashmere High School: STEM | 10 | 6 | 0 | 6 | 0 | 0% |
| Kashmere High School: STEM | 11 | 1 | 0 | 1 | 0 | 0% |
| Kashmere High School: STEM | 12 | 1 | 0 | 1 | 0 | 0% |
| Key Middle School: Fine Arts | 6 | 13 | 0 | 13 | 156 | 0% |
| Key Middle School: Fine Arts | 7 | 0 | 0 | 0 | 156 | 0% |
| Key Middle School: Fine Arts | 8 | 2 | 0 | 2 | 156 | 50% |
| Kinder High School for the Performing and Visual Arts (HSPVA) | 9 | 1,149 | 55 | 220 | 430 | 18% |
| Kinder High School for the Performing and Visual Arts (HSPVA) | 10 | 137 | 0 | 8 | 80 | 6% |
| Kinder High School for the Performing and Visual Arts (HSPVA) | 11 | 76 | 0 | 1 | 35 | 1% |
| Kinder High School for the Performing and Visual Arts (HSPVA) | 12 | 19 | 0 | 0 | 12 | 0% |
| Kolter Elementary: Foreign Languages & Cultures | K | 308 | 1 | 308 | 40 | 11% |
| Kolter Elementary: Foreign Languages & Cultures | 1 | 73 | 0 | 73 | 1 | 0% |
| Kolter Elementary: Foreign Languages & Cultures | 2 | 58 | 0 | 58 | 1 | 0% |
| Kolter Elementary: Foreign Languages & Cultures | 3 | 40 | 0 | 40 | 0 | 0% |
| Kolter Elementary: Foreign Languages & Cultures | 4 | 54 | 0 | 54 | 0 | 0% |
| Kolter Elementary: Foreign Languages & Cultures | 5 | 29 | 0 | 29 | 0 | 0% |
| Lamar High School: Business Administration | 9 | 548 | 9 | 520 | 130 | 17% |
| Lanier Middle School: Vanguard (Gifted and Talented) | 6 | 1,102 | 18 | 1,013 | 250 | 17% |
| Lantrip Elementary: Environmental Science | K | 37 | 0 | 37 | 75 | 27% |
| Lantrip Elementary: Environmental Science | 1 | 5 | 0 | 5 | 0 | 20% |
| Lantrip Elementary: Environmental Science | 2 | 12 | 0 | 12 | 0 | 25% |
| Lantrip Elementary: Environmental Science | 3 | 4 | 0 | 4 | 0 | 50% |
| Lantrip Elementary: Environmental Science | 4 | 2 | 0 | 2 | 0 | 50% |
| Lantrip Elementary: Environmental Science | 5 | 5 | 0 | 5 | 0 | 0% |
| Lawson Middle School: Performing and Visual Arts | 6 | 74 | 2 | 20 | 105 | 0% |
| Lawson Middle School: Performing and Visual Arts | 7 | 10 | 0 | 0 | 105 | 0% |
| Lawson Middle School: Performing and Visual Arts | 8 | 9 | 0 | 0 | 105 | 0% |
| Lockhart Elementary: STEM | K | 21 | 1 | 21 | 55 | 10% |
| Lockhart Elementary: STEM | 1 | 11 | 0 | 11 | 45 | 9% |
| Lockhart Elementary: STEM | 2 | 5 | 0 | 5 | 45 | 40% |
| Lockhart Elementary: STEM | 3 | 5 | 0 | 5 | 45 | 20% |
| Lockhart Elementary: STEM | 4 | 5 | 0 | 5 | 45 | 40% |
| Lockhart Elementary: STEM | 5 | 4 | 0 | 4 | 45 | 0% |
| Long Academy: Pharmacy Technology - Career Early College | 9 | 0 | 0 | 0 | 0 | 0% |
| Long Academy: Pharmacy Technology - Career Early College | 10 | 17 | 0 | 14 | 100 | 6% |
| Long Academy: P-TECH | 9 | 95 | 0 | 95 | 150 | 11% |
| Long Academy: STEM+Medical | 6 | 37 | 0 | 37 | 100 | 3% |
| Long Academy: STEM+Medical | 7 | 4 | 0 | 4 | 100 | 0% |
| Long Academy: STEM+Medical | 8 | 5 | 0 | 5 | 100 | 20% |
| Longfellow Elementary: Creative and Performing Arts | K | 25 | 1 | 25 | 55 | 16% |
| Longfellow Elementary: Creative and Performing Arts | 1 | 10 | 0 | 10 | 20 | 10% |
| Longfellow Elementary: Creative and Performing Arts | 2 | 5 | 0 | 5 | 10 | 40% |
| Longfellow Elementary: Creative and Performing Arts | 3 | 7 | 0 | 7 | 10 | 29% |
| Longfellow Elementary: Creative and Performing Arts | 4 | 11 | 0 | 11 | 10 | 27% |
| Longfellow Elementary: Creative and Performing Arts | 5 | 8 | 0 | 8 | 20 | 13% |
| Lovett Elementary: Fine Arts | K | 270 | 0 | 270 | 65 | 17% |
| Lovett Elementary: Fine Arts | 1 | 49 | 0 | 49 | 0 | 0% |
| Lovett Elementary: Fine Arts | 2 | 55 | 0 | 55 | 5 | 2% |
| Lovett Elementary: Fine Arts | 3 | 34 | 0 | 34 | 0 | 0% |
| Lovett Elementary: Fine Arts | 4 | 49 | 0 | 49 | 0 | 0% |
| Lovett Elementary: Fine Arts | 5 | 30 | 0 | 30 | 0 | 0% |
| MacGregor Elementary: Music & Science | K | 58 | 0 | 58 | 100 | 33% |
| MacGregor Elementary: Music & Science | 1 | 14 | 0 | 14 | 42 | 14% |
| MacGregor Elementary: Music & Science | 2 | 13 | 0 | 13 | 2 | 8% |
| MacGregor Elementary: Music & Science | 3 | 15 | 0 | 15 | 15 | 13% |
| MacGregor Elementary: Music & Science | 4 | 11 | 0 | 11 | 20 | 0% |
| MacGregor Elementary: Music & Science | 5 | 9 | 0 | 9 | 5 | 33% |
| Madison High School: Careers STEM | 9 | 0 | 0 | 0 | 60 | 0% |
| Madison High School: Engineering | 9 | 28 | 0 | 27 | 0 | 0% |
| Madison High School: Engineering | 10 | 8 | 0 | 6 | 0 | 0% |
| Madison High School: Health Science | 9 | 33 | 0 | 32 | 0 | 0% |
| Madison High School: Health Science | 10 | 7 | 0 | 5 | 0 | 0% |
| Mandarin Immersion Magnet School | K | 240 | 2 | 240 | 46 | 14% |
| Mandarin Immersion Magnet School | 1 | 75 | 0 | 75 | 3 | 1% |
| Mandarin Immersion Magnet School | 2 | 47 | 0 | 47 | 2 | 6% |
| Mandarin Immersion Magnet School | 3 | 44 | 0 | 44 | 1 | 2% |
| Mandarin Immersion Magnet School | 4 | 47 | 0 | 47 | 0 | 0% |
| Mandarin Immersion Magnet School | 5 | 23 | 0 | 23 | 0 | 0% |
| Mandarin Immersion Magnet School | 6 | 273 | 3 | 273 | 20 | 5% |
| Mandarin Immersion Magnet School | 7 | 36 | 0 | 36 | 0 | 0% |
| Mandarin Immersion Magnet School | 8 | 14 | 0 | 14 | 0 | 0% |
| Marshall Middle School: Fine Arts | 6 | 44 | 4 | 31 | 840 | 11% |
| Marshall Middle School: Fine Arts | 7 | 3 | 0 | 2 | 840 | 0% |
| Marshall Middle School: Fine Arts | 8 | 4 | 0 | 2 | 800 | 0% |
| McReynolds Middle School: STEAM | 6 | 28 | 0 | 28 | 95 | 7% |
| Meyerland Middle School: Performing: Visual Arts | 6 | 1,376 | 8 | 562 | 616 | 14% |
| Meyerland Middle School: Performing: Visual Arts | 7 | 124 | 0 | 30 | 173 | 10% |
| Meyerland Middle School: Performing: Visual Arts | 8 | 64 | 0 | 17 | 150 | 11% |
| Mickey Leland College Prep: College Preparatory | 6 | 81 | 0 | 77 | 60 | 14% |
| Mickey Leland College Prep: College Preparatory | 7 | 6 | 0 | 5 | 30 | 50% |
| Mickey Leland College Prep: College Preparatory | 8 | 4 | 0 | 4 | 0 | 0% |
| Mickey Leland College Prep: College Preparatory | 9 | 52 | 0 | 46 | 0 | 2% |
| Mickey Leland College Prep: College Preparatory | 10 | 10 | 0 | 10 | 30 | 10% |
| Mickey Leland College Prep: College Preparatory | 11 | 5 | 0 | 4 | 0 | 0% |
| Mickey Leland College Prep: College Preparatory | 12 | 0 | 0 | 0 | 0 | 0% |
| Milby High School - Aerospace Engineering | 9 | 102 | 2 | 99 | 125 | 15% |
| Milby High School - Aerospace Engineering | 10 | 6 | 0 | 6 | 0 | 0% |
| Milby High School - Entrepreneurship | 9 | 95 | 5 | 92 | 150 | 19% |
| Milby High School - Entrepreneurship | 10 | 10 | 0 | 9 | 0 | 0% |
| Milby High School - Health Science | 9 | 135 | 3 | 131 | 150 | 38% |
| Milby High School - Health Science | 10 | 13 | 0 | 12 | 0 | 0% |
| Milby High School - Petroleum Engineering | 9 | 68 | 4 | 66 | 100 | 24% |
| Milby High School - Petroleum Engineering | 10 | 6 | 0 | 6 | 0 | 0% |
| North Houston Early College HS: Early College High School | 9 | 420 | 0 | 408 | 125 | 24% |
| North Houston Early College HS: Early College High School | 10 | 70 | 0 | 55 | 2 | 1% |
| Northside High School - Arts/Audio Visual Production (Northside TV) | 9 | 18 | 0 | 18 | 200 | 11% |
| Northside High School - Arts/Audio Visual Production (Northside TV) | 10 | 0 | 0 | 0 | 100 | 0% |
| Northside High School - Culinary Arts | 9 | 35 | 0 | 34 | 200 | 23% |
| Northside High School - Culinary Arts | 10 | 8 | 0 | 7 | 100 | 13% |
| Northside High School - Digital Media/Information Technology | 9 | 15 | 0 | 14 | 200 | 20% |
| Northside High School - Digital Media/Information Technology | 10 | 2 | 0 | 2 | 100 | 0% |
| Northside High School - Hotel Management | 9 | 9 | 0 | 9 | 100 | 11% |
| Northside High School - Hotel Management | 10 | 0 | 0 | 0 | 50 | 0% |
| Northside High School: Web Development | 9 | 0 | 0 | 0 | 0 | 0% |
| Oak Forest Elementary: Vanguard (Gifted and Talented) | K | 83 | 0 | 58 | 8 | 10% |
| Oak Forest Elementary: Vanguard (Gifted and Talented) | 1 | 19 | 0 | 11 | 5 | 11% |
| Oak Forest Elementary: Vanguard (Gifted and Talented) | 2 | 30 | 0 | 25 | 1 | 0% |
| Oak Forest Elementary: Vanguard (Gifted and Talented) | 3 | 31 | 0 | 29 | 1 | 0% |
| Oak Forest Elementary: Vanguard (Gifted and Talented) | 4 | 25 | 0 | 22 | 2 | 4% |
| Oak Forest Elementary: Vanguard (Gifted and Talented) | 5 | 12 | 0 | 11 | 1 | 8% |
| Ortiz Middle School: Performing and Visual Arts | 6 | 126 | 0 | 124 | 735 | 6% |
| Ortiz Middle School: Performing and Visual Arts | 7 | 4 | 0 | 4 | 510 | 0% |
| Ortiz Middle School: Performing and Visual Arts | 8 | 2 | 0 | 2 | 350 | 0% |
| Parker Elementary: Music | K | 173 | 2 | 173 | 70 | 30% |
| Parker Elementary: Music | 1 | 35 | 0 | 35 | 5 | 11% |
| Parker Elementary: Music | 2 | 45 | 0 | 45 | 0 | 0% |
| Parker Elementary: Music | 3 | 21 | 0 | 21 | 0 | 0% |
| Patterson Elementary: Literature | K | 25 | 0 | 25 | 110 | 20% |
| Patterson Elementary: Literature | 1 | 4 | 0 | 4 | 50 | 0% |
| Patterson Elementary: Literature | 2 | 2 | 0 | 2 | 50 | 0% |
| Patterson Elementary: Literature | 3 | 1 | 0 | 1 | 50 | 0% |
| Patterson Elementary: Literature | 4 | 0 | 0 | 0 | 50 | 0% |
| Patterson Elementary: Literature | 5 | 1 | 0 | 1 | 50 | 0% |
| Pershing Middle School: Fine Arts | 6 | 1,162 | 15 | 503 | 255 | 8% |
| Pershing Middle School: Fine Arts | 7 | 92 | 0 | 17 | 63 | 5% |
| Pershing Middle School: Fine Arts | 8 | 44 | 0 | 7 | 22 | 9% |
| Pin Oak Middle School: Foreign Languages | 6 | 1,509 | 29 | 1,509 | 150 | 8% |
| Pin Oak Middle School: Foreign Languages | 7 | 154 | 0 | 154 | 0 | 0% |
| Pin Oak Middle School: Foreign Languages | 8 | 103 | 0 | 103 | 0 | 0% |
| Poe Elementary: Fine Arts | K | 217 | 2 | 217 | 10 | 4% |
| Poe Elementary: Fine Arts | 1 | 51 | 0 | 51 | 1 | 2% |
| Poe Elementary: Fine Arts | 2 | 37 | 0 | 37 | 1 | 3% |
| Poe Elementary: Fine Arts | 3 | 25 | 0 | 25 | 1 | 0% |
| Poe Elementary: Fine Arts | 4 | 25 | 0 | 25 | 5 | 8% |
| Poe Elementary: Fine Arts | 5 | 14 | 0 | 14 | 0 | 0% |
| Pugh Elementary: Science and Technology | K | 11 | 0 | 11 | 50 | 0% |
| Pugh Elementary: Science and Technology | 1 | 7 | 0 | 7 | 50 | 0% |
| Pugh Elementary: Science and Technology | 2 | 3 | 0 | 3 | 50 | 0% |
| Pugh Elementary: Science and Technology | 3 | 2 | 0 | 2 | 56 | 0% |
| Pugh Elementary: Science and Technology | 4 | 3 | 0 | 3 | 56 | 0% |
| Pugh Elementary: Science and Technology | 5 | 5 | 0 | 5 | 56 | 0% |
| Red Elementary School: STEM | K | 127 | 3 | 127 | 60 | 28% |
| Red Elementary School: STEM | 1 | 20 | 0 | 20 | 45 | 30% |
| Red Elementary School: STEM | 2 | 17 | 0 | 17 | 25 | 6% |
| Red Elementary School: STEM | 3 | 8 | 0 | 8 | 10 | 13% |
| Red Elementary School: STEM | 4 | 15 | 0 | 15 | 10 | 27% |
| Red Elementary School: STEM | 5 | 15 | 0 | 15 | 5 | 27% |
| Revere Middle School: STEM | 6 | 50 | 0 | 50 | 150 | 8% |
| Revere Middle School: STEM | 7 | 7 | 0 | 7 | 150 | 14% |
| Revere Middle School: STEM | 8 | 1 | 0 | 1 | 150 | 0% |
| River Oaks Elementary School: Vanguard (Gifted and Talented) | K | 180 | 10 | 113 | 51 | 18% |
| River Oaks Elementary School: Vanguard (Gifted and Talented) | 1 | 60 | 0 | 45 | 11 | 8% |
| River Oaks Elementary School: Vanguard (Gifted and Talented) | 2 | 68 | 0 | 57 | 2 | 1% |
| River Oaks Elementary School: Vanguard (Gifted and Talented) | 3 | 74 | 0 | 62 | 7 | 3% |
| River Oaks Elementary School: Vanguard (Gifted and Talented) | 4 | 81 | 0 | 71 | 2 | 0% |
| River Oaks Elementary School: Vanguard (Gifted and Talented) | 5 | 54 | 0 | 42 | 16 | 11% |
| Roosevelt Elementary School: Vanguard (Gifted and Talented) | K | 8 | 0 | 6 | 10 | 0% |
| Roosevelt Elementary School: Vanguard (Gifted and Talented) | 1 | 3 | 0 | 2 | 5 | 0% |
| Roosevelt Elementary School: Vanguard (Gifted and Talented) | 2 | 3 | 0 | 3 | 10 | 0% |
| Roosevelt Elementary School: Vanguard (Gifted and Talented) | 3 | 5 | 0 | 5 | 5 | 20% |
| Roosevelt Elementary School: Vanguard (Gifted and Talented) | 4 | 2 | 0 | 2 | 10 | 0% |
| Roosevelt Elementary School: Vanguard (Gifted and Talented) | 5 | 1 | 0 | 1 | 5 | 100% |
| Ross Elementary School: STEM | K | 3 | 0 | 3 | 20 | 0% |
| Ross Elementary School: STEM | 1 | 2 | 0 | 2 | 20 | 0% |
| Ross Elementary School: STEM | 2 | 3 | 0 | 3 | 20 | 33% |
| Ross Elementary School: STEM | 3 | 0 | 0 | 0 | 20 | 0% |
| Ross Elementary School: STEM | 4 | 1 | 0 | 1 | 20 | 0% |
| Ross Elementary School: STEM | 5 | 0 | 0 | 0 | 20 | 0% |
| Sam Houston Center for Math, Science and Technology: Medical Careers | 9 | 97 | 3 | 91 | 60 | 10% |
| Scarborough High School: Language | 9 | 23 | 0 | 23 | 45 | 4% |
| Scarborough High School: Language | 10 | 12 | 0 | 9 | 0 | 0% |
| Scroggins Elementary: Fine Arts | K | 9 | 0 | 9 | 25 | 33% |
| Scroggins Elementary: Fine Arts | 1 | 2 | 0 | 2 | 15 | 50% |
| Scroggins Elementary: Fine Arts | 2 | 1 | 0 | 1 | 15 | 0% |
| Scroggins Elementary: Fine Arts | 3 | 1 | 0 | 1 | 15 | 0% |
| Scroggins Elementary: Fine Arts | 4 | 1 | 0 | 1 | 15 | 0% |
| Scroggins Elementary: Fine Arts | 5 | 2 | 0 | 2 | 15 | 0% |
| Shadowbriar Elementary: STEAM | K | 48 | 0 | 48 | 51 | 19% |
| Shadowbriar Elementary: STEAM | 1 | 10 | 0 | 10 | 44 | 30% |
| Shadowbriar Elementary: STEAM | 2 | 3 | 0 | 3 | 56 | 0% |
| Shadowbriar Elementary: STEAM | 3 | 6 | 0 | 6 | 44 | 50% |
| Shadowbriar Elementary: STEAM | 4 | 3 | 0 | 3 | 45 | 0% |
| Shadowbriar Elementary: STEAM | 5 | 5 | 0 | 5 | 20 | 0% |
| Sharpstown International: Early College High School | 9 | 218 | 2 | 182 | 0 | 8% |
| Sharpstown International: Early College High School | 10 | 0 | 0 | 0 | 0 | 0% |
| Sharpstown International: Early College High School | 11 | 0 | 0 | 0 | 0 | 0% |
| Sharpstown International: International Studies | 6 | 293 | 8 | 293 | 250 | 54% |
| Sharpstown International: International Studies | 7 | 24 | 0 | 24 | 30 | 54% |
| Sharpstown International: International Studies | 8 | 26 | 0 | 26 | 20 | 35% |
| Sharpstown International: International Studies | 9 | 127 | 1 | 103 | 40 | 14% |
| Sharpstown International: International Studies | 10 | 27 | 0 | 20 | 10 | 19% |
| Sharpstown International: International Studies | 11 | 21 | 0 | 15 | 20 | 24% |
| Sharpstown International: International Studies | 12 | 3 | 0 | 1 | 0 | 0% |
| Sinclair Elementary: STEM | K | 217 | 0 | 217 | 15 | 6% |
| Sinclair Elementary: STEM | 1 | 43 | 0 | 43 | 15 | 12% |
| Sinclair Elementary: STEM | 2 | 31 | 0 | 31 | 5 | 3% |
| Sinclair Elementary: STEM | 3 | 28 | 0 | 28 | 5 | 14% |
| Sinclair Elementary: STEM | 4 | 20 | 0 | 20 | 5 | 20% |
| Sinclair Elementary: STEM | 5 | 0 | 0 | 0 | 0 | 0% |
| South Early College HS: STEM | 9 | 365 | 4 | 337 | 160 | 30% |
| South Early College HS: STEM | 10 | 65 | 0 | 50 | 25 | 26% |
| South Early College HS: STEM | 11 | 33 | 0 | 25 | 0 | 0% |
| South Early College HS: STEM | 12 | 7 | 0 | 4 | 0 | 0% |
| Sterling High School: Aviation Science | 9 | 49 | 1 | 47 | 100 | 16% |
| Sterling High School: Aviation Science | 10 | 4 | 0 | 4 | 100 | 25% |
| Sterling High School: Career Early College | 9 | 53 | 0 | 49 | 130 | 9% |
| Sterling High School: Career Early College | 10 | 12 | 0 | 11 | 70 | 0% |
| Stevens Elementary: STEAM | K | 20 | 0 | 20 | 40 | 5% |
| Stevens Elementary: STEAM | 1 | 4 | 0 | 4 | 20 | 25% |
| Stevens Elementary: STEAM | 2 | 2 | 0 | 2 | 18 | 0% |
| Stevens Elementary: STEAM | 3 | 3 | 0 | 3 | 15 | 0% |
| Stevens Elementary: STEAM | 4 | 2 | 0 | 2 | 20 | 0% |
| Stevens Elementary: STEAM | 5 | 2 | 0 | 2 | 0 | 0% |
| Stevenson Middle School: STEM | 6 | 159 | 9 | 159 | 300 | 58% |
| Stevenson Middle School: STEM | 7 | 10 | 0 | 10 | 100 | 60% |
| Stevenson Middle School: STEM | 8 | 5 | 0 | 5 | 100 | 0% |
| T H Rogers School: Vanguard (Gifted and Talented) | K | 152 | 1 | 101 | 96 | 37% |
| T H Rogers School: Vanguard (Gifted and Talented) | 1 | 60 | 0 | 47 | 21 | 40% |
| T H Rogers School: Vanguard (Gifted and Talented) | 2 | 89 | 0 | 76 | 0 | 7% |
| T H Rogers School: Vanguard (Gifted and Talented) | 3 | 107 | 0 | 97 | 1 | 10% |
| T H Rogers School: Vanguard (Gifted and Talented) | 4 | 141 | 0 | 133 | 3 | 8% |
| T H Rogers School: Vanguard (Gifted and Talented) | 5 | 106 | 0 | 90 | 16 | 13% |
| T H Rogers School: Vanguard (Gifted and Talented) | 6 | 795 | 2 | 744 | 94 | 11% |
| T H Rogers School: Vanguard (Gifted and Talented) | 7 | 105 | 0 | 85 | 0 | 18% |
| T H Rogers School: Vanguard (Gifted and Talented) | 8 | 51 | 0 | 40 | 4 | 18% |
| The Rice School: STEM | K | 195 | 3 | 195 | 110 | 37% |
| The Rice School: STEM | 1 | 61 | 0 | 61 | 39 | 31% |
| The Rice School: STEM | 2 | 51 | 0 | 51 | 15 | 20% |
| The Rice School: STEM | 3 | 48 | 0 | 48 | 10 | 17% |
| The Rice School: STEM | 4 | 60 | 0 | 60 | 10 | 7% |
| The Rice School: STEM | 5 | 45 | 0 | 45 | 32 | 53% |
| The Rice School: STEM | 6 | 526 | 4 | 526 | 65 | 7% |
| The Rice School: STEM | 7 | 57 | 0 | 57 | 15 | 14% |
| The Rice School: STEM | 8 | 35 | 0 | 35 | 0 | 0% |
| Travis Elementary School: Vanguard (Gifted and Talented) | K | 87 | 0 | 58 | 35 | 22% |
| Travis Elementary School: Vanguard (Gifted and Talented) | 1 | 19 | 0 | 17 | 22 | 26% |
| Travis Elementary School: Vanguard (Gifted and Talented) | 2 | 25 | 0 | 20 | 8 | 12% |
| Travis Elementary School: Vanguard (Gifted and Talented) | 3 | 31 | 0 | 27 | 5 | 6% |
| Travis Elementary School: Vanguard (Gifted and Talented) | 4 | 27 | 0 | 23 | 0 | 11% |
| Travis Elementary School: Vanguard (Gifted and Talented) | 5 | 0 | 0 | 0 | 0 | 0% |
| Valley West Elementary: STEM | K | 23 | 1 | 23 | 8 | 22% |
| Valley West Elementary: STEM | 1 | 6 | 0 | 6 | 17 | 83% |
| Valley West Elementary: STEM | 2 | 2 | 0 | 2 | 10 | 0% |
| Valley West Elementary: STEM | 3 | 2 | 0 | 2 | 3 | 0% |
| Valley West Elementary: STEM | 4 | 7 | 0 | 7 | 0 | 29% |
| Valley West Elementary: STEM | 5 | 4 | 0 | 4 | 11 | 0% |
| Wainwright Elementary: Math and Science | K | 9 | 8 | 9 | 50 | 0% |
| Wainwright Elementary: Math and Science | 1 | 0 | 0 | 0 | 30 | 0% |
| Wainwright Elementary: Math and Science | 2 | 1 | 1 | 1 | 30 | 0% |
| Wainwright Elementary: Math and Science | 3 | 1 | 1 | 1 | 20 | 0% |
| Wainwright Elementary: Math and Science | 4 | 3 | 3 | 3 | 30 | 0% |
| Wainwright Elementary: Math and Science | 5 | 2 | 2 | 2 | 25 | 0% |
| Waltrip High School - Digital Communication | 9 | 54 | 1 | 44 | 50 | 7% |
| Waltrip High School - Digital Communication | 10 | 3 | 0 | 3 | 0 | 0% |
| Waltrip High School - Engineering | 9 | 102 | 1 | 83 | 90 | 24% |
| Waltrip High School - Engineering | 10 | 13 | 0 | 11 | 0 | 0% |
| Waltrip High School - Graphic Design and Multimedia Arts | 9 | 91 | 0 | 78 | 60 | 10% |
| Waltrip High School - Graphic Design and Multimedia Arts | 10 | 7 | 0 | 2 | 0 | 0% |
| Washington BT High School: Aerospace and Engineering | 9 | 68 | 1 | 63 | 100 | 10% |
| Washington BT High School: Aerospace and Engineering | 10 | 8 | 0 | 7 | 50 | 0% |
| Washington BT High School: Aerospace and Engineering | 11 | 4 | 0 | 0 | 0 | 0% |
| Welch Middle School: Sports Medicine and Fine Arts | 6 | 43 | 0 | 43 | 240 | 0% |
| Welch Middle School: Sports Medicine and Fine Arts | 7 | 23 | 0 | 23 | 240 | 0% |
| Welch Middle School: Sports Medicine and Fine Arts | 8 | 7 | 0 | 7 | 240 | 0% |
| Wesley Elementary: Aerospace and STEM Academy | K | 5 | 0 | 5 | 35 | 0% |
| Wesley Elementary: Aerospace and STEM Academy | 1 | 1 | 0 | 1 | 35 | 0% |
| Wesley Elementary: Aerospace and STEM Academy | 2 | 1 | 0 | 1 | 35 | 0% |
| Wesley Elementary: Aerospace and STEM Academy | 3 | 1 | 0 | 1 | 35 | 0% |
| Wesley Elementary: Aerospace and STEM Academy | 4 | 1 | 0 | 1 | 35 | 0% |
| Wesley Elementary: Aerospace and STEM Academy | 5 | 0 | 0 | 0 | 35 | 0% |
| Westbury High School: Performing and Visual Arts | 9 | 215 | 3 | 51 | 235 | 9% |
| Westbury High School: Performing and Visual Arts | 10 | 26 | 0 | 15 | 135 | 35% |
| Westbury High School: Performing and Visual Arts | 11 | 46 | 0 | 22 | 120 | 26% |
| Westbury High School: Performing and Visual Arts | 12 | 35 | 0 | 24 | 92 | 17% |
| Westside High School STEAM | 9 | 630 | 13 | 591 | 395 | 16% |
| Westside High School STEAM | 10 | 20 | 0 | 13 | 140 | 0% |
| Westside High School: FUTURES | 9 | 44 | 1 | 40 | 25 | 43% |
| Westside High School: FUTURES | 10 | 23 | 0 | 18 | 10 | 26% |
| Wharton Dual Language: Dual Language | K | 277 | 0 | 277 | 32 | 8% |
| Wharton Dual Language: Dual Language | 1 | 80 | 0 | 80 | 16 | 15% |
| Wharton Dual Language: Dual Language | 2 | 42 | 0 | 42 | 7 | 7% |
| Wharton Dual Language: Dual Language | 3 | 32 | 0 | 32 | 11 | 22% |
| Wharton Dual Language: Dual Language | 4 | 25 | 0 | 25 | 19 | 12% |
| Wharton Dual Language: Dual Language | 5 | 19 | 0 | 19 | 26 | 0% |
| Wharton Dual Language: Dual Language | 6 | 227 | 0 | 227 | 50 | 19% |
| Wharton Dual Language: Dual Language | 7 | 18 | 0 | 18 | 10 | 22% |
| Wharton Dual Language: Dual Language | 8 | 13 | 0 | 13 | 12 | 23% |
| Whidby Elementary: Health Science | K | 10 | 0 | 10 | 30 | 0% |
| Whidby Elementary: Health Science | 1 | 3 | 0 | 3 | 20 | 0% |
| Whidby Elementary: Health Science | 2 | 3 | 0 | 3 | 15 | 0% |
| Whidby Elementary: Health Science | 3 | 1 | 0 | 1 | 10 | 0% |
| Whidby Elementary: Health Science | 4 | 4 | 0 | 4 | 10 | 0% |
| Whidby Elementary: Health Science | 5 | 7 | 0 | 7 | 10 | 0% |
| Williams Middle School: STEM | 6 | 5 | 0 | 5 | 100 | 0% |
| Williams Middle School: STEM | 7 | 2 | 0 | 2 | 100 | 0% |
| Williams Middle School: STEM | 8 | 1 | 0 | 1 | 100 | 0% |
| Windsor Village Elementary: Vanguard (Gifted and Talented) | K | 10 | 0 | 6 | 30 | 10% |
| Windsor Village Elementary: Vanguard (Gifted and Talented) | 1 | 4 | 0 | 4 | 40 | 25% |
| Windsor Village Elementary: Vanguard (Gifted and Talented) | 2 | 3 | 0 | 3 | 39 | 0% |
| Windsor Village Elementary: Vanguard (Gifted and Talented) | 3 | 1 | 0 | 0 | 29 | 0% |
| Windsor Village Elementary: Vanguard (Gifted and Talented) | 4 | 4 | 0 | 3 | 34 | 25% |
| Windsor Village Elementary: Vanguard (Gifted and Talented) | 5 | 3 | 0 | 2 | 33 | 33% |
| Worthing High School: Agriculture and Aquatic Science | 9 | 0 | 0 | 0 | 100 | 0% |
| Yates HS - Digital Communications | 9 | 8 | 0 | 8 | 50 | 0% |
| Yates HS - Digital Communications | 10 | 2 | 0 | 1 | 50 | 50% |
| Yates HS - Digital Communications | 11 | 1 | 0 | 0 | 25 | 0% |
| Yates HS - Digital Communications | 12 | 1 | 0 | 1 | 0 | 0% |
| Yates HS - Graphic Design and Multimedia | 9 | 25 | 2 | 25 | 75 | 24% |
| Yates HS - Graphic Design and Multimedia | 10 | 3 | 0 | 3 | 75 | 33% |
| Yates HS - Graphic Design and Multimedia | 11 | 0 | 0 | 0 | 30 | 0% |
| Yates HS - Graphic Design and Multimedia | 12 | 0 | 0 | 0 | 0 | 0% |
| Yates HS - School Of Communications | 9 | 13 | 0 | 13 | 25 | 15% |
| Yates HS - School Of Communications | 10 | 2 | 0 | 2 | 25 | 100% |
| Yates HS - School Of Communications | 11 | 1 | 0 | 1 | 5 | 0% |
| Yates HS - School Of Communications | 12 | 0 | 0 | 0 | 0 | 0% |
| Yates HS: Maritime Academy | 9 | 17 | 0 | 17 | 45 | 0% |
| Yates HS: Maritime Academy | 10 | 1 | 0 | 1 | 30 | 0% |
| Yates HS: Maritime Academy | 11 | 0 | 0 | 0 | 10 | 0% |
| Yates HS: Maritime Academy | 12 | 0 | 0 | 0 | 10 | 0% |
| Young Women's College Prep: College Preparatory STEM | 6 | 228 | 3 | 214 | 120 | 39% |
| Young Women's College Prep: College Preparatory STEM | 7 | 35 | 0 | 27 | 5 | 11% |
| Young Women's College Prep: College Preparatory STEM | 8 | 19 | 0 | 17 | 5 | 16% |
| Young Women's College Prep: College Preparatory STEM | 9 | 185 | 1 | 162 | 30 | 8% |
| Young Women's College Prep: College Preparatory STEM | 10 | 29 | 0 | 28 | 8 | 17% |
| Herrera Elementary: Integrated Technology- | 1 | 0 | 0 | 0 | 4 | 0% |
| High School for Law and Justice: Law Enforcement | 9 | 463 | 2 | 437 | 180 | 26% |
| High School for Law and Justice: Law Enforcement | 10 | 43 | 0 | 37 | 20 | 19% |
| Jones Futures Academy - Career Early College | 9 | 61 | 0 | 61 | 105 | 21% |
| Jones Futures Academy - Career Early College | 10 | 10 | 0 | 10 | 50 | 20% |
| Jones Futures Academy - Career Early College | 11 | 16 | 0 | 16 | 20 | 31% |
| Jones Futures Academy - Career Early College | 12 | 1 | 0 | 1 | 10 | 100% |
| Jones Futures Academy - P-Tech | 9 | 19 | 0 | 18 | 40 | 0% |
| Jones Futures Academy - P-Tech | 10 | 2 | 0 | 2 | 15 | 0% |
| Jones Futures Academy - P-Tech | 11 | 9 | 0 | 9 | 0 | 0% |
| Jones Futures Academy - P-Tech | 12 | 2 | 0 | 2 | 0 | 0% |
| Program | Grade Level | Phase 1 Apps | Silbling Apps | Qualified Apps | Seats Available | % Accepted |
HISD presented these data as accurate on August 11, 2025. Click here learn more about how to apply to an HISD magnet school.
Learn More about Houston Schools
- How to Apply to a Houston (HISD) Magnet School
- Houston’s Top Elementary and Middle Schools by STAAR Scores
- Houston Private School Tuition
About General Academic’s Research and Analysis
For more than 20 years, General Academic has provided tutoring, test preparation, and consulting services in addition to producing publications like this one.
* This analysis is based off data acquired from HISD through the Texas Public Information Act and looks specifically at the numbers available on August 11, 2025. This date is significant, because it specifically reflects the outcome from Phase I of the lottery, which is the only phase when seats are available at popular schools.
The dataset provided by HISD’s information office for the 2025-2026 school year is less complete than the previous years we’ve conducted this analysis; this deficit appears to be the result of a switch to a new application form for the 2022-2023 school year. In particular it is missing information on family income status and acceptance rates. Additionally, for fine arts magnets, the district’s application numbers confound actual students with discrete programs. In general, the number of applicants to fine arts schools appears to be double the actual number of students, because students can and usually do apply to up to 2 programs at middle and high school. As such, we halved the number of applicants to middle and high school fine arts programs stated by the district in the charts above, which were more in line with previous years. We validated the numbers directly with school campuses when possible.
This article was last updated on December 17, 2025.
Authors
-
Britnee Chuor is General Academic's Assistant Manager and Lead Tutor. She holds a Master of Global Policy Studies degree from The University of Texas at Austin and B.A in Political Science from the University of Houston. In 2019, Britnee served as a Fulbright English Teaching Assistant at a bilingual high school in Madrid, Spain.
View all posts
-
Samuel Pearson is General Academic's Lead Manager and Director of College Counseling. He graduated from Rice University in 2017 with a B.A. in Cognitive Science & Visual and Dramatic Arts. Before joining General Academic's team in 2023, Samuel was a high school teacher and technical director at a premier independent school in Houston. He holds a Certificate of College Access Counseling from Rice University's Center for College Readiness.
View all posts