
West University Elementary, the second best performing elementary school in HISD by STAAR scores
T.H. Rogers continues its reign as Houston Independent School District (HISD)‘s best elementary and middle school by Texas STAAR test scores. Other top elementary schools include West University, Mandarin Immersion Magnet School (MIMS), River Oaks Elementary, and Roberts. MIMS is the district’s #2 elementary and #2 middle school. Other top middle schools are Lanier, Briarmeadow Charter, and Pin Oak.
Steep entry requirements and their locations within high-income neighborhoods, or some combination of both of these factors, nearly guarantee the success of many of these top Houston schools. For example, take the top school, T.H. Rogers. It is HISD’s only vanguard elementary school, which means that every student must be both gifted and talented and also win a lottery for enrollment. At Mandarin Immersion, every student must study Mandarin Chinese and win the lottery. At West University, Roberts, River Oaks, Horn, Oak Forest, and Travis a vast majority of students are not considered economically disadvantaged, unlike the majority of HISD public schools.
These qualifiers are important to note, since the relative wealth of their students’ families is still undeniably one of, if not the, best indicator of how a school performs on the STAAR test. The best strategy for parents seeking the best public elementary or middle school education for their children, then, is to simply follow the money. That being said, families unable to afford million dollar homes are not without hope: they can still enter the district’s annual School Choice lottery, which allows thousands of students to attend schools outside of their zoned neighborhoods.
Texas STAAR Test Grading Levels
The State of Texas Assessments of Academic Readiness (STAAR) tests are the primary, quantitative measure of academic performance for Texas public schools. All public school students in grades 3-12 take some number of STAAR tests, although the testing is most consistent in grades 3-8. The STAAR is administered every spring in core subjects including reading, writing, mathematics, science, and social studies. The rankings in this article reflect the most recent test results from spring of 2026. Students’ scores are placed into four performance categories:
- Did Not Meet Grade Level – Like an “F” on a regular report card
- Approaches Grade Level – C
- Meets Grade Level – B
- Masters Grade Level – A
STAAR “Masters Grade Level” Approximates the College-Going Population
“Masters Grade Level” is the highest performance score level that a Texas public school student can achieve. How many students reach this designation on the STAAR test varies fairly significantly between grades and subjects, but generally, in 2026, if an elementary school student achieved a “Masters” level in math, they scored in the top 19% of students, and if they achieved it in ELA, they scored in the top 25% of students. If a middle school student achieved a “Masters” level in math, they scored in the top 9% of students, and if they achieved it in ELA, they scored in the top 28% of students.
The Texas Education Agency (TEA) asserts that students who score in the top two levels, “Meets” or “Masters,” have a more than 60% chance of passing college courses. As such, the “Masters” level, and the top part of the “Meets” level is essentially the percent of the population that is expected go on to earn a four year college degree. A Texas public school’s Report Card will always show the percentage of enrolled students who scored in each of the four performance categories.
This ranking looks specifically at the percentage of a school’s students who scored in the highest, “Masters Grade Level” performance category. Because “Masters Grade Level” represents about the top 1/5 of public school students in Texas, any school where more than 20% of students are scoring above this level is outperforming the state average.
Family Income Plays an Outsized Role
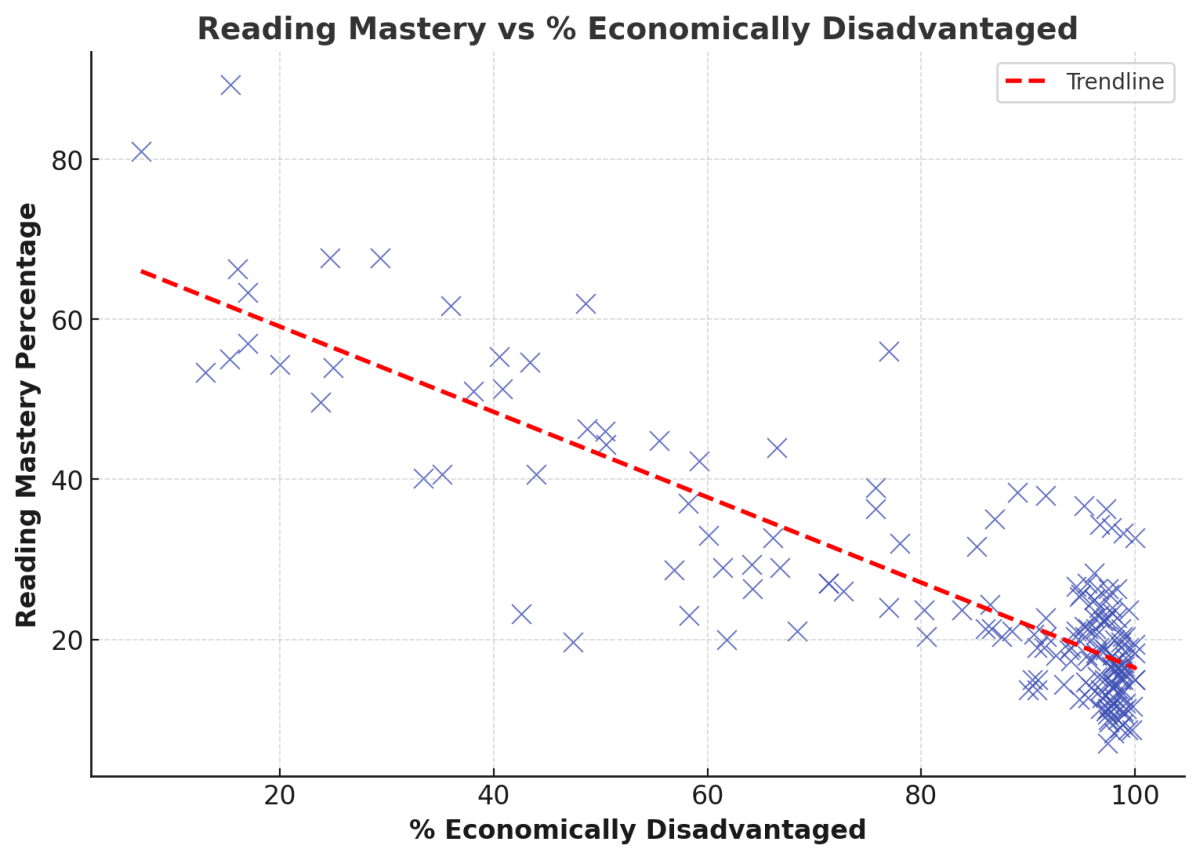
The biggest indicator of success on a school’s test scores is the family wealth of its student population. General Academic calculated the weighted R-squared (R²) values between percent of students mastering the STAAR and the percentage of students who qualify for federal free and reduced lunch. R-Squared is a standard statistical measure to determine how predictable a dependent variable (STAAR scores) is simply by looking at the independent variable (family income).
In Texas, a family of four typically qualifies for a reduced price lunch when their household income is below $57,720 (175% above poverty level) or a free lunch when their household income is below $40,560 (123% above poverty). Among all the subject and grade levels we analyzed, middle school reading showed the strongest relationship between poverty level and test mastery. About 78% of the variation in those reading scores can be predicted from the percentage of economically disadvantaged students:
- Elementary School Reading Mastery – .701 R² correlation
- Elementary School Math Mastery – .714
- Middle School Reading Mastery – .782
- Middle School Math Mastery – .299
This seemingly inextricable link between family income and academic results does change over time. Students’ scores in math go up – the R-squared value falls from .714 at elementary school to .299 in middle school. However, student’s scores in reading remain strongly linked to family income – the R-squared value even increases slightly from .701 to .782.
How Income Plays a Role in Student Enrollment
The top elementary and middle schools fall under these three categories:
- Vanguard (Ex: TH Rogers)
- Magnet-Only (MIMS, Pin Oak)
- and Neighborhood (West University)
Each of these schools have differing requirements for entry, which affects the make up of their student population. Vanguard schools require students to be Gifted and Talented (GT) and to apply in order to gain entry.
Magnet-only schools still require students to apply, but they don’t necessarily have to be GT, though this might make them more competitive options, since the applicant pool is often larger. That being said, many magnet schools have other requirements for entry, like MIMS, which requires potential applicants to demonstrate some Mandarin proficiency for entry into certain grade-levels.
Neighborhood schools don’t require an application process, but rather accept all students who are zoned for that school. If there are extra slots at these schools, students who are not zoned can apply to attend them via the Houston School Choice Lottery. Unsurprisingly, the strongest neighborhood schools are popular among families and parents, and thus often don’t have many spots available for non-zoned students.
Improve Your Child's Math & Reading Skills
Learn more about General Academic's Elementary Learning ProgramFor 1st through 5th grade elementary students, our Elementary Learning program for math and English is a superior alternative to strip mall learning centers. Twice a week, students meet privately with one of our brilliant tutors working through our personalized curriculum. Click here to learn more.
Top Houston ISD Elementary Schools by STAAR “Masters” Scores
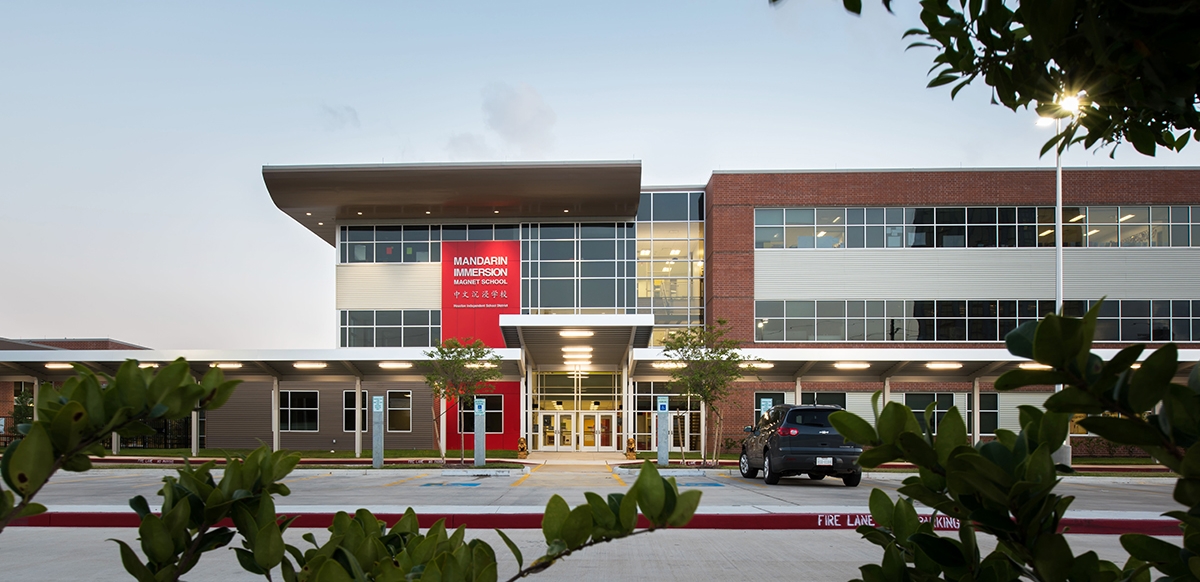
Mandarin Immersion Magnet School, the third best elementary school in HISD by STAAR scores
The best Houston ISD elementary schools are T.H. Rogers, West University, Mandarin Immersion (MIMS), River Oaks Elementary, and Roberts Elementary. As in past years, in 2026 T.H. Rogers was the top elementary school by math and reading scores. MIMS had the second highest performance in math, and West University had the second highest performance in reading. Although Roberts Elementary’s combined mastery held steady this year, it was edged out of the fourth spot by River Oaks Elementary, whose math mastery rose by nine percentage points and English mastery rose by one percentage point.
Among the current top-ten elementary schools, Oak Forest and Travis saw the largest gains–both tied for a increase of nine percentage points in their combined mastery levels. on the other hand, Kolter Elementary, which was a top-ten school in 2025, has dropped to the 15th spot this year, and saw a seven point drop in its combined mastery level. Field Elementary, however, entered the top-ten (at the 10th spot), its combined mastery level rising by eight percentage points.
Since the STAAR is a peer-normed test in which only about 22% of elementary students will earn the “Masters” designation, any school on this list with higher than 22% is performing better than average. There are 75 (43%) Houston ISD elementary schools that are outperforming the Texas state average, which is an improvement on last year’s 39%.
The table below shows the percent of students scoring at the “Masters” level on the STAAR test in math, reading, and their combined average. Additionally, “Disadvantaged” indicates the percentage of enrollment that qualifies for a free or reduced lunch.
HISD Elementary Schools by STAAR Scores (2026)
| wdt_ID | wdt_created_by | wdt_created_at | wdt_last_edited_by | wdt_last_edited_at | Rank | Organization | Combined | Math | Reading | Disadvantaged |
|---|---|---|---|---|---|---|---|---|---|---|
| 1 | hannahkelly | 09/28/2026 01:15 PM | hannahkelly | 09/28/2026 01:15 PM | 1 | T H ROGERS SCHOOL | 85% | 82% | 87% | 11% |
| 2 | hannahkelly | 09/28/2026 01:15 PM | hannahkelly | 09/28/2026 01:15 PM | 2 | WEST UNIVERSITY EL | 83% | 81% | 84% | 6% |
| 3 | hannahkelly | 09/28/2026 01:15 PM | hannahkelly | 09/28/2026 01:15 PM | 3 | MANDARIN IMMERSION MAGNET SCHOOL | 77% | 83% | 70% | 22% |
| 4 | hannahkelly | 09/28/2026 01:15 PM | hannahkelly | 09/28/2026 01:15 PM | 4 | RIVER OAKS EL | 67% | 66% | 67% | 10% |
| 5 | hannahkelly | 09/28/2026 01:15 PM | hannahkelly | 09/28/2026 01:15 PM | 5 | ROBERTS EL | 66% | 66% | 66% | 18% |
| 6 | hannahkelly | 09/28/2026 01:15 PM | hannahkelly | 09/28/2026 01:15 PM | 6 | OAK FOREST EL | 64% | 61% | 67% | 11% |
| 7 | hannahkelly | 09/28/2026 01:15 PM | hannahkelly | 09/28/2026 01:15 PM | 7 | TRAVIS EL | 61% | 58% | 63% | 14% |
| 8 | hannahkelly | 09/28/2026 01:15 PM | hannahkelly | 09/28/2026 01:15 PM | 8 | HORN EL | 57% | 56% | 57% | 16% |
| 9 | hannahkelly | 09/28/2026 01:15 PM | hannahkelly | 09/28/2026 01:15 PM | 9 | CONDIT EL | 55% | 46% | 64% | 36% |
| 10 | hannahkelly | 09/28/2026 01:15 PM | hannahkelly | 09/28/2026 01:15 PM | 10 | FIELD EL | 54% | 50% | 58% | 42% |
| 11 | hannahkelly | 09/28/2026 01:15 PM | hannahkelly | 09/28/2026 01:15 PM | 11 | SINCLAIR EL | 50% | 44% | 56% | 33% |
| 12 | hannahkelly | 09/28/2026 01:15 PM | hannahkelly | 09/28/2026 01:15 PM | 12 | BUSH EL | 49% | 44% | 53% | 29% |
| 13 | hannahkelly | 09/28/2026 01:15 PM | hannahkelly | 09/28/2026 01:15 PM | 13 | TWAIN EL | 49% | 40% | 57% | 19% |
| 14 | hannahkelly | 09/28/2026 01:15 PM | hannahkelly | 09/28/2026 01:15 PM | 14 | HARVARD EL | 48% | 38% | 57% | 11% |
| 15 | hannahkelly | 09/28/2026 01:15 PM | hannahkelly | 09/28/2026 01:15 PM | 15 | KOLTER EL | 48% | 45% | 51% | 24% |
| 16 | hannahkelly | 09/28/2026 01:15 PM | hannahkelly | 09/28/2026 01:15 PM | 16 | BRIARMEADOW CHARTER | 45% | 41% | 49% | 43% |
| 17 | hannahkelly | 09/28/2026 01:15 PM | hannahkelly | 09/28/2026 01:15 PM | 17 | ARABIC IMMERSION MAGNET SCHOOL | 42% | 40% | 44% | 52% |
| 18 | hannahkelly | 09/28/2026 01:15 PM | hannahkelly | 09/28/2026 01:15 PM | 18 | HELMS EL | 42% | 44% | 40% | 49% |
| 19 | hannahkelly | 09/28/2026 01:15 PM | hannahkelly | 09/28/2026 01:15 PM | 19 | LOVETT EL | 40% | 32% | 47% | 40% |
| 20 | hannahkelly | 09/28/2026 01:15 PM | hannahkelly | 09/28/2026 01:15 PM | 20 | BROOKLINE EL | 39% | 43% | 34% | 97% |
| 21 | hannahkelly | 09/28/2026 01:15 PM | hannahkelly | 09/28/2026 01:15 PM | 21 | CRESPO EL | 38% | 31% | 45% | 94% |
| 22 | hannahkelly | 09/28/2026 01:15 PM | hannahkelly | 09/28/2026 01:15 PM | 22 | MEMORIAL EL | 38% | 31% | 44% | 35% |
| 23 | hannahkelly | 09/28/2026 01:15 PM | hannahkelly | 09/28/2026 01:15 PM | 23 | PARKER EL | 37% | 33% | 40% | 41% |
| 24 | hannahkelly | 09/28/2026 01:15 PM | hannahkelly | 09/28/2026 01:15 PM | 24 | ELLA J BAKER MONTESSORI SCHOOL | 36% | 29% | 43% | 32% |
| 25 | hannahkelly | 09/28/2026 01:15 PM | hannahkelly | 09/28/2026 01:15 PM | 25 | DURHAM EL | 35% | 33% | 37% | 58% |
| Rank | Organization | Combined | Math | Reading | Disadvantaged |
Top Houston ISD Middle Schools by STAAR “Masters” Scores

T. H. Rogers, the top performing elementary and middle school in HISD by STAAR scores
Although the top two spots remain the same as last year (T.H. Rogers and MIMS respectively), it’s important to note the significant narrowing of the gap between them in this year’s STAAR results: in 2025 T.H. Rogers had a 26 point lead over MIMS for combined mastery level, but in 2026, that gap has dropped to a mere 12 points. This is due to a seven point drop in T.H. Rogers’ combined mastery level, and a seven point increase in MIMS’s. If this trend continues, Mandarin Immersion may overtake T.H. Rogers’ top position in the next year or two. Other top HISD middle schools are Briarmeadow Charter, Pin Oak, Lanier, and Project Chrysalis.
Lanier saw a moderate drop-off this year, from third to fifth place (they saw a seven point drop in their combined mastery level from their 2025 results), while both Briarmeadow and Pin Oak saw gains in both combined mastery levels (+five points and +four points respectively) and their overall rankings. Wharton overtook Arabic Immersion for the seventh spot, driven largely by a 16 point improvement in their reading scores in 2026.
Project Chrysalis, which saw a rise from the 11th spot to the sixth spot last year, holds steady in it’s ranking this year. Its STAAR results are particularly impressive given the fact that 85% of its students are economically disadvantaged–a number that’s more than 30 percentage points greater than the next most economically disadvantaged school in the top ten, Hogg Middle.
In middle school, statistically fewer students reach the “Masters” designation than in elementary school–only about 18% of students statewide. Twenty-seven HISD middle schools are out-performing this number, a number that represents 47% of all HISD middle schools.
The table below shows the percent of students scoring at the “Masters” level on the STAAR test in math, reading, and their combined average. Additionally, “Disadvantaged” indicates the percentage of enrollment that qualifies for a free or reduced lunch.
HISD Middle Schools by STAAR Scores (2026)
| wdt_ID | wdt_created_by | wdt_created_at | wdt_last_edited_by | wdt_last_edited_at | Rank | Organization | Combined | Math | Reading | Disadvantaged |
|---|---|---|---|---|---|---|---|---|---|---|
| 1 | hannahkelly | 09/28/2026 01:22 PM | hannahkelly | 09/28/2026 01:22 PM | 1 | T H ROGERS SCHOOL | 78% | 63% | 93% | 11% |
| 2 | hannahkelly | 09/28/2026 01:22 PM | hannahkelly | 09/28/2026 01:22 PM | 2 | MANDARIN IMMERSION MAGNET SCHOOL | 66% | 59% | 72% | 22% |
| 3 | hannahkelly | 09/28/2026 01:22 PM | hannahkelly | 09/28/2026 01:22 PM | 3 | BRIARMEADOW CHARTER | 56% | 47% | 65% | 43% |
| 4 | hannahkelly | 09/28/2026 01:22 PM | hannahkelly | 09/28/2026 01:22 PM | 4 | PIN OAK MIDDLE | 54% | 38% | 69% | 43% |
| 5 | hannahkelly | 09/28/2026 01:22 PM | hannahkelly | 09/28/2026 01:22 PM | 5 | LANIER MIDDLE | 52% | 31% | 72% | 26% |
| 6 | hannahkelly | 09/28/2026 01:22 PM | hannahkelly | 09/28/2026 01:22 PM | 6 | PROJECT CHRYSALIS MIDDLE | 46% | 34% | 58% | 85% |
| 7 | hannahkelly | 09/28/2026 01:22 PM | hannahkelly | 09/28/2026 01:22 PM | 7 | WHARTON K-8 DUAL LANGUAGE ACADEMY | 46% | 31% | 60% | 39% |
| 8 | hannahkelly | 09/28/2026 01:22 PM | hannahkelly | 09/28/2026 01:22 PM | 8 | ARABIC IMMERSION MAGNET SCHOOL | 42% | 28% | 55% | 52% |
| 9 | hannahkelly | 09/28/2026 01:22 PM | hannahkelly | 09/28/2026 01:22 PM | 9 | ELLA J BAKER MONTESSORI SCHOOL | 37% | 18% | 55% | 32% |
| 10 | hannahkelly | 09/28/2026 01:22 PM | hannahkelly | 09/28/2026 01:22 PM | 10 | HOGG MIDDLE | 37% | 23% | 51% | 51% |
| 11 | hannahkelly | 09/28/2026 01:22 PM | hannahkelly | 09/28/2026 01:22 PM | 11 | GARDEN OAKS MONTESSORI | 31% | 19% | 42% | 43% |
| 12 | hannahkelly | 09/28/2026 01:22 PM | hannahkelly | 09/28/2026 01:22 PM | 12 | YOUNG WOMEN'S COLLEGE PREP ACADEMY | 30% | 12% | 48% | 59% |
| 13 | hannahkelly | 09/28/2026 01:22 PM | hannahkelly | 09/28/2026 01:22 PM | 13 | BAYLOR COLLEGE OF MEDICINE ACADEMY AT RYAN | 28% | 13% | 42% | 70% |
| 14 | hannahkelly | 09/28/2026 01:22 PM | hannahkelly | 09/28/2026 01:22 PM | 14 | BLACK MIDDLE | 28% | 14% | 42% | 56% |
| 15 | hannahkelly | 09/28/2026 01:22 PM | hannahkelly | 09/28/2026 01:22 PM | 15 | MEYERLAND MIDDLE | 28% | 13% | 43% | 52% |
| 16 | hannahkelly | 09/28/2026 01:22 PM | hannahkelly | 09/28/2026 01:22 PM | 16 | ENERGIZED FOR EXCELLENCE ACADEMY INC MIDDLE | 26% | 19% | 32% | 97% |
| 17 | hannahkelly | 09/28/2026 01:22 PM | hannahkelly | 09/28/2026 01:22 PM | 17 | MICKEY LELAND COLLEGE PREP ACAD FOR YOUNG MEN | 26% | 23% | 28% | 77% |
| 18 | hannahkelly | 09/28/2026 01:22 PM | hannahkelly | 09/28/2026 01:22 PM | 18 | PILGRIM ACADEMY | 26% | 15% | 36% | 98% |
| 19 | hannahkelly | 09/28/2026 01:22 PM | hannahkelly | 09/28/2026 01:22 PM | 19 | HAMILTON MIDDLE | 25% | 14% | 35% | 80% |
| 20 | hannahkelly | 09/28/2026 01:22 PM | hannahkelly | 09/28/2026 01:22 PM | 20 | PERSHING MIDDLE | 22% | 11% | 32% | 59% |
| 21 | hannahkelly | 09/28/2026 01:22 PM | hannahkelly | 09/28/2026 01:22 PM | 21 | STEVENSON MIDDLE | 22% | 13% | 30% | 91% |
| 22 | hannahkelly | 09/28/2026 01:22 PM | hannahkelly | 09/28/2026 01:22 PM | 22 | BAYLOR COLLEGE OF MEDICINE BIOTECH ACADEMY AT RUSK | 21% | 11% | 31% | 75% |
| 23 | hannahkelly | 09/28/2026 01:22 PM | hannahkelly | 09/28/2026 01:22 PM | 23 | RICE SCH /LA ESCUELA RICE | 21% | 7% | 34% | 62% |
| 24 | hannahkelly | 09/28/2026 01:22 PM | hannahkelly | 09/28/2026 01:22 PM | 24 | EDISON MIDDLE | 20% | 18% | 21% | 100% |
| 25 | hannahkelly | 09/28/2026 01:22 PM | hannahkelly | 09/28/2026 01:22 PM | 25 | WEST BRIAR MIDDLE | 20% | 10% | 29% | 69% |
| Rank | Organization | Combined | Math | Reading | Disadvantaged |
STAAR Scores: Relative to School Success
While family income plays the biggest role in student success when it comes to STAAR results, other factors the district has more control over can also make a meaningful difference.
Project Chrysalis has made headway in their STAAR scores, and a deeper look at their origins makes their climb that much more impressive. Twenty years ago, HISD created Project Chrysalis Middle School to support a group of 25 at-risk youth that might have fallen through the cracks had they attended a traditional middle school. Now, they are one of the top middle schools in Houston, and indeed the state of Texas, thanks in part to their “project-based curriculum”.
Their reading mastery is especially impressive when considering the fact that about 95% of their students are hispanic, many of them first-generation. Because of their popularity, they are at capacity and currently unable to accept magnet transfers.
Unlike Project Chrysalis, Ella J. Baker Montessori is an example of a school with a largely affluent student-base that is under-performing on the STAAR test. As a Montessori school, its curriculum is non-traditional, emphasizing cognitive development at different stages of adolescence and individualized student-learning goals rather than traditional academics. This lack of emphasis on testing likely explains their relatively low STAAR results: while they are #4 in the city by wealth, they rank #10 based on STAAR scores.
Clearly, a school’s particular academic emphasis plays an important role in how student success is actualized. Even in schools where student population tends toward the economically disadvantaged, diligent preparation and a strong academic emphasis can boost student scoring above what we would predict given the school’s demographics.
About the Data
This dataset was compiled from data pulled from TEA Assessment Research Portal, from the 2025-2026 school year, specifically the Spring 2026 STAAR data. The two data tables represent Grades 3-5 average performance for elementary schools, and Grades 6-8 average performance for middle schools. “Percent Mastery” scores for both Math and Reading represent the total number of students at a school who earned a performance level of “Mastery” in the respective STAAR 3-8 subject, divided by the total number of students at the same school who took the STAAR 3-8 exam for that subject. The “combined mastery” column in the tables above is simply the average of the math and reading scores. The data regarding percentage of economically disadvantaged students comes from Children at Risk. For an interactive map of Houston-area school districts with schools, visit the TEA’s website.