The Texas Education Agency has finally released statewide SAT results for the class of 2024, and the results are good for Houston (TEA’s SAT data is always 1 year late). Three out of the top 10 public schools in the state are in the Houston-area, including 2 from Houston ISD (HISD), and the very best school is from Spring Branch (SBISD). The average SAT score for all Texans was a 982 out of 1600 versus 1024 for the entire nation. Texas’s score is slightly lower than the national average due to its high testing rate, which includes students who wouldn’t otherwise have taken the SAT had their school not required it.
![]() The Houston-area’s top public high schools with an average SAT score of 1373 (96th percentile) are:
The Houston-area’s top public high schools with an average SAT score of 1373 (96th percentile) are:
- Spring Branch Academic Institute (Spring Branch)
- Carnegie Vanguard High School (HISD)
- DeBakey High School for Health Professions (HISD)
The best general enrollment high schools in the Houston area are among the top 30 in Texas and have an average SAT score of 1222 (83rd percentile):
- Clements High School (Fort Bend ISD)
- Seven Lakes High School (Katy)
- Memorial High School (Spring Branch)
- The Woodlands High School (Conroe)
- Glenda Dawson High School (Pearland)
Within HISD specifically, the top schools are Carnegie Vanguard, DeBakey and Kinder HSPVA. Within SBISD, the top schools are Spring Branch Academic Institute, Memorial, and Westchester.
At Fort Bend ISD, the top schools are Clements, Austin, and Elkins. Within Katy ISD (the top schools are Seven Lakes, Tompkins, and Jordan. Within Clear Creek ISD, the top schools are Clear Horizons, Clear Lake, and Clear Springs.
The most popular colleges among graduating high school Texans include Texas A&M, University of Texas Austin, and the University of Houston. Baylor University (7) is the most popular private college followed by Rice University (12) and Texas Christian University (15).
The most popular college majors among SAT-takers include Health Professions, Business, and Engineering.
Houston High School SAT Score Key Takeaways
- There are many high performing public schools in the Houston area.
- Several of the top schools are lottery based magnet schools for gifted and talented students.
- Regardless of their school, all students can and should independently prepare for the SAT test.
How to Read These Tables
- “Composite” refers to the total SAT composite score out of 1600, which is the sum of the “Reading” and “Math” scores that are each out of 800.
- “# Tested” refers to how many students of that graduating class took the SAT. This number may be masked in the data in some cases, and will only be an estimate (ex: “<75” for less than 75 students taking the exam).
- “Participation” gives a percentage of the students in the graduating class that have SAT scores in their school’s data.
- “CCR” refers to what percent of the testers have met the SAT benchmark for Career and College Readiness by scoring both above a 530 in the Math portion and above a 480 on the Reading section. “Benchmark” score are the minimum score a student can earn and still be considered college and career ready by the non-profit developer of the SAT test, College Board.
Top Houston ISD (HISD) High Schools by SAT Scores
Houston’s top, public high schools by SAT test scores are Carnegie Vanguard, DeBakey, and Kinder HSPVA. Carnegie is also the Houston-area’s top public school by National Merit Semifinalists, students who scored in the top 1% on the PSAT.
The average SAT score at number one Carnegie Vanguard was a 1350 out of 1600 for the graduating class of 2024. This score places Carnegie’s seniors among the top 8% of all seniors nationwide. Medical-career focused DeBakey isn’t far behind at 1292, placing its seniors among the top 12%. Kinder HSPVA’s score of a 1199 places its fine arts students among the top 20%.
All three of HISD’s top-schools are comprised solely of magnet-transfer students designated as gifted and talented, meaning the brightest 14% of students in the district. The top three “general enrollment” high schools are Bellaire (1096), Lamar (989), and Westside (974).
The average SAT score across HISD’s 45 high schools was a 920 out of 1600, which is a decline from last year’s 933. About 70% of all Texas seniors took the SAT in 2024, where the average score fell to a 971 down from 978, and nationwide the average fell to a 1024 from 1028. These scores for HISD’s class of 2024 represent the last group of juniors’ testing performance before the state’s takeover of the district in June 2023.
| Rank | wdt_ID | wdt_created_by | wdt_created_at | wdt_last_edited_by | wdt_last_edited_at | School | Composite | Reading | Math | # Tested | Participation | CCR |
|---|---|---|---|---|---|---|---|---|---|---|---|---|
| 1 | 1 | alexjohn | 12/09/2025 03:06 PM | alexjohn | 12/09/2025 03:06 PM | Carnegie Vanguard HS | 1350 | 675 | 675 | <225 | 100 | 94 |
| 2 | 2 | alexjohn | 12/09/2025 03:06 PM | alexjohn | 12/09/2025 03:06 PM | DeBakey HS for Health Prof | 1292 | 639 | 653 | 210 | 100 | 90 |
| 3 | 3 | alexjohn | 12/09/2025 03:06 PM | alexjohn | 12/09/2025 03:06 PM | Kinder HS for Performing | 1199 | 626 | 573 | 201 | 100 | 71 |
| 4 | 4 | alexjohn | 12/09/2025 03:06 PM | alexjohn | 12/09/2025 03:06 PM | Energy Institute HS | 1158 | 590 | 568 | 187 | 100 | 65 |
| 5 | 5 | alexjohn | 12/09/2025 03:06 PM | alexjohn | 12/09/2025 03:06 PM | Bellaire HS | 1096 | 558 | 538 | 584 | 89 | 50 |
| 6 | 6 | alexjohn | 12/09/2025 03:06 PM | alexjohn | 12/09/2025 03:06 PM | Young Women's College Prep Academy | 1080 | 559 | 521 | <50 | 100 | 44 |
| 7 | 7 | alexjohn | 12/09/2025 03:06 PM | alexjohn | 12/09/2025 03:06 PM | Eastwood Academy | 1058 | 542 | 515 | <125 | 100 | 45 |
| 8 | 8 | alexjohn | 12/09/2025 03:06 PM | alexjohn | 12/09/2025 03:06 PM | East ECHS | 1049 | 537 | 512 | <125 | 99 | 47 |
| 9 | 9 | alexjohn | 12/09/2025 03:06 PM | alexjohn | 12/09/2025 03:06 PM | Houston Academy | 1034 | 548 | 486 | <125 | 100 | 35 |
| 10 | 10 | alexjohn | 12/09/2025 03:06 PM | alexjohn | 12/09/2025 03:06 PM | North Houston ECHS | 1022 | 528 | 494 | <125 | 100 | 36 |
| Rank | School | Composite | Reading | Math | # Tested | Participation | CCR |
Only 23% of HISD seniors met the minimum benchmark score for college and career readiness.
The district’s average English score of a 473 out of 800, barely places seniors below the 480 benchmark. However HISD’s average math score of 451 out of 800 is significantly below the 530 benchmark. Only at Carnegie, DeBakey, HSPVA, and Energy Institute did more than 51% of graduating seniors meet College Boards’s benchmark scores.
HISD’s average composite score of a 924 places the district’s seniors in the 31st percentile, meaning that 69 percent of seniors nationwide are scoring higher. However, standardized test scores like the SAT and ACT remain inextricably linked to race and particularly family income. When HISD’s scores are weighted by demographics, it actually matches and sometimes exceeds state and national results².
Similar to the STAAR test for younger students, Texas pays for and essentially requires most public school juniors to take either the ACT or SAT. As such, the participation rate at HISD was 87% for the class of 2024, which would have taken the test in-class in the spring of 2023.
The low SAT benchmark scores may help to explain why only 47% of Americans hold an associates degree or higher when more than 62% of high school graduates go on to attend college.
Top Spring Branch ISD (SBISD) High Schools by SAT Scores
Spring Branch ISD’s Class of 2024 SAT results show strong overall performance, especially at the top end. Spring Branch Academic Institute (SBAI) stands out as technically the best school in the state with a 97th percentile composite score of 1478. However, enrollment at SBAI is very selective. Fewer than 25 students took the SAT for the class of 2024 at SBAI.
Memorial High School led the general enrollment campuses with an average composite score of 1215, while Westchester Academy and Stratford High School followed with 1118 and 1092, respectively. The districtwide average of 1040 remains above both the state and national averages, demonstrating solid academic outcomes across schools. Notably,
| Rank | wdt_ID | wdt_created_by | wdt_created_at | wdt_last_edited_by | wdt_last_edited_at | School | Composite | Reading | Math | # Tested | Participation | CCR |
|---|---|---|---|---|---|---|---|---|---|---|---|---|
| 1 | 1 | alexjohn | 12/09/2025 03:14 PM | alexjohn | 12/09/2025 03:14 PM | Spring Branch Academic Institute | 1478 | 740 | 738 | <25 | 86 | 100 |
| 2 | 2 | alexjohn | 12/09/2025 03:14 PM | alexjohn | 12/09/2025 03:14 PM | Memorial HS | 1215 | 608 | 607 | 631 | 99 | 76 |
| 3 | 3 | alexjohn | 12/09/2025 03:14 PM | alexjohn | 12/09/2025 03:14 PM | Westchester Academy | 1118 | 569 | 549 | <125 | 100 | 60 |
| 4 | 4 | alexjohn | 12/09/2025 03:14 PM | alexjohn | 12/09/2025 03:14 PM | Stratford HS | 1092 | 555 | 538 | 519 | 98 | 54 |
| 5 | 5 | alexjohn | 12/09/2025 03:14 PM | alexjohn | 12/09/2025 03:14 PM | Northbrook HS | 898 | 447 | 451 | <525 | 92 | 17 |
| 6 | 6 | alexjohn | 12/09/2025 03:14 PM | alexjohn | 12/09/2025 03:14 PM | Spring Woods HS | 860 | 429 | 431 | <450 | 100 | 16 |
| Rank | School | Composite | Reading | Math | # Tested | Participation | CCR |
Top Fort Bend ISD (FBISD) High Schools by SAT Scores
Fort Bend ISD demonstrates consistently strong SAT performance anchored by Clements High School, which posts an exceptional 1236 composite and maintains a 75.6% college-readiness rate. A large group of schools, including Austin, Elkins, Dulles, and Travis, score in the 1080–1135 range, reflecting the district’s overall academic strength. Participation is unusually high (many schools above 90% and some at 100%), making these averages credible indicators of district-wide performance. While some campuses like Marshall and Willowridge show lower readiness rates and composites, the district as a whole ranks among the most academically competitive large districts in Texas.
| Rank | wdt_ID | wdt_created_by | wdt_created_at | wdt_last_edited_by | wdt_last_edited_at | School | Composite | Reading | Math | # Tested | Participation | CCR |
|---|---|---|---|---|---|---|---|---|---|---|---|---|
| 1 | 1 | alexjohn | 12/09/2025 03:25 PM | alexjohn | 12/09/2025 03:25 PM | Clements HS | 1236 | 611 | 625 | 582 | 95 | 76 |
| 2 | 2 | alexjohn | 12/09/2025 03:25 PM | alexjohn | 12/09/2025 03:25 PM | Stephen F Austin HS | 1134 | 572 | 562 | 501 | 89 | 62 |
| 3 | 3 | alexjohn | 12/09/2025 03:25 PM | alexjohn | 12/09/2025 03:25 PM | Lawrence E Elkins HS | 1129 | 570 | 559 | 598 | 93 | 58 |
| 4 | 4 | alexjohn | 12/09/2025 03:25 PM | alexjohn | 12/09/2025 03:25 PM | Dulles HS | 1128 | 562 | 566 | 559 | 96 | 55 |
| 5 | 5 | alexjohn | 12/09/2025 03:25 PM | alexjohn | 12/09/2025 03:25 PM | William B Travis HS | 1086 | 551 | 535 | 789 | 100 | 50 |
| 6 | 6 | alexjohn | 12/09/2025 03:25 PM | alexjohn | 12/09/2025 03:25 PM | Ridge Point HS | 1082 | 552 | 530 | 644 | 88 | 51 |
| 7 | 7 | alexjohn | 12/09/2025 03:25 PM | alexjohn | 12/09/2025 03:25 PM | Kempner HS | 1012 | 512 | 500 | 441 | 88 | 36 |
| 8 | 8 | alexjohn | 12/09/2025 03:25 PM | alexjohn | 12/09/2025 03:26 PM | George Bush HS | 951 | 484 | 467 | 475 | 81 | 22 |
| 9 | 9 | alexjohn | 12/09/2025 03:25 PM | alexjohn | 12/09/2025 03:25 PM | Hightower HS | 920 | 473 | 447 | 528 | 79 | 18 |
| 10 | 10 | alexjohn | 12/09/2025 03:25 PM | alexjohn | 12/09/2025 03:26 PM | Thurgood Marshall HS | 843 | 431 | 411 | 275 | 83 | 9 |
| Rank | School | Composite | Reading | Math | # Tested | Participation | CCR |
Top Katy ISD (KISD) High Schools by SAT Scores
Katy ISD continues to demonstrate elite SAT performance, led by Seven Lakes, Tompkins, and Jordan, all scoring near or above 1190—placing them among the top public high schools in the Houston area. These three campuses show balanced strength across Reading and Math, each posting scores around 590–620 in both sections. A second tier—including Cinco Ranch, Taylor, and Katy HS—performs solidly in the 1090–1120 range. Participation rates remain very high across the district, ensuring reliable comparisons. Katy’s top schools match or surpass the best-performing campuses in Fort Bend, reaffirming KISD’s status as one of the strongest academically competitive districts in Texas.
| Rank | wdt_ID | wdt_created_by | wdt_created_at | wdt_last_edited_by | wdt_last_edited_at | School | Composite | Reading | Math | # Tested | Participation | CCR |
|---|---|---|---|---|---|---|---|---|---|---|---|---|
| 1 | 1 | alexjohn | 12/09/2025 03:17 PM | alexjohn | 12/09/2025 03:17 PM | Seven Lakes HS | 1236 | 615 | 621 | 864 | 98 | 77 |
| 2 | 2 | alexjohn | 12/09/2025 03:17 PM | alexjohn | 12/09/2025 03:17 PM | Tompkins HS | 1191 | 595 | 596 | 693 | 97 | 72 |
| 3 | 3 | alexjohn | 12/09/2025 03:17 PM | alexjohn | 12/09/2025 03:17 PM | Jordan HS | 1190 | 590 | 600 | 648 | 97 | 70 |
| 4 | 4 | alexjohn | 12/09/2025 03:17 PM | alexjohn | 12/09/2025 03:17 PM | Cinco Ranch HS | 1120 | 557 | 563 | 838 | 94 | 58 |
| 5 | 5 | alexjohn | 12/09/2025 03:17 PM | alexjohn | 12/09/2025 03:17 PM | Taylor HS | 1117 | 555 | 562 | 642 | 90 | 60 |
| 6 | 6 | alexjohn | 12/09/2025 03:17 PM | alexjohn | 12/09/2025 03:17 PM | Katy HS | 1052 | 529 | 523 | 690 | 87 | 45 |
| 7 | 7 | alexjohn | 12/09/2025 03:17 PM | alexjohn | 12/09/2025 03:17 PM | Paetow HS | 937 | 477 | 459 | 735 | 89 | 21 |
| 8 | 8 | alexjohn | 12/09/2025 03:17 PM | alexjohn | 12/09/2025 03:19 PM | Morton Ranch HS | 934 | 475 | 459 | 500 | 81 | 22 |
| 9 | 9 | alexjohn | 12/09/2025 03:17 PM | alexjohn | 12/09/2025 03:20 PM | Mayde Creek HS | 920 | 466 | 454 | 500 | 83 | 20 |
| Rank | School | Composite | Reading | Math | # Tested | Participation | CCR |
Top Clear Creek ISD (CCISD) High Schools by SAT Scores
Clear Creek ISD’s SAT performance shows a clear tiered structure, with Clear Horizons Early College High School leading the district at 1127, well above the other campuses. The next highest performers—Clear Lake, Clear Springs, and Clear Falls—cluster tightly in the 1039–1063 range, while Clear Brook and Clear View trail behind, the latter scoring below 900. Reading scores across the district tend to outpace Math by a small margin, and participation rates remain high (mostly above 85%), suggesting the scores reflect broad student performance rather than selective testing. Overall, CCISD’s strongest schools are competitive at the regional level, but the district shows sizable performance gaps between campuses.
| Rank | wdt_ID | wdt_created_by | wdt_created_at | wdt_last_edited_by | wdt_last_edited_at | School | Composite | Reading | Math | # Tested | Participation | CCR |
|---|---|---|---|---|---|---|---|---|---|---|---|---|
| 1 | 1 | alexjohn | 12/09/2025 03:22 PM | alexjohn | 12/09/2025 03:22 PM | Clear Horizons ECHS | 1127 | 565 | 562 | <125 | 100 | 69 |
| 2 | 2 | alexjohn | 12/09/2025 03:22 PM | alexjohn | 12/09/2025 03:22 PM | Clear Lake HS | 1063 | 537 | 527 | 549 | 92 | 46 |
| 3 | 3 | alexjohn | 12/09/2025 03:22 PM | alexjohn | 12/09/2025 03:22 PM | Clear Springs HS | 1054 | 537 | 517 | 563 | 87 | 48 |
| 4 | 4 | alexjohn | 12/09/2025 03:22 PM | alexjohn | 12/09/2025 03:22 PM | Clear Falls HS | 1039 | 529 | 510 | 513 | 86 | 43 |
| 5 | 5 | alexjohn | 12/09/2025 03:22 PM | alexjohn | 12/09/2025 03:22 PM | Clear Brook HS | 993 | 509 | 484 | 517 | 91 | 34 |
| 6 | 6 | alexjohn | 12/09/2025 03:22 PM | alexjohn | 12/09/2025 03:22 PM | Clear Creek HS | 992 | 507 | 486 | 463 | 92 | 35 |
| Rank | School | Composite | Reading | Math | # Tested | Participation | CCR |
How Does Houston ISD Compare with other Houston Area School Districts?
When looking at district-level data, Houston ISD’s Class of 2024 SAT performance trails most other nearby districts. With an average composite score of 924, Houston ranks 38th out of 62 districts in the dataset. The statewide average across Texas districts is approximately 982, meaning Houston students scored about 60 points lower on average.
Some of HISD’s performance can be attributed to scale, as they are the largest district in the state by a wide margin, with their 10,117 testers being nearly double the next largest district. Also, HISD’s urban student body is significantly less well-off than the state average. Nearly 80% of the district’s students qualify for the federal free and reduced lunch program compared to 57% for all Texas students.
| Rank | wdt_ID | wdt_created_by | wdt_created_at | wdt_last_edited_by | wdt_last_edited_at | District | Composite | Reading | Math | # Tested | Participation | CCR |
|---|---|---|---|---|---|---|---|---|---|---|---|---|
| 1 | 1 | alexjohn | 12/09/2025 03:29 PM | alexjohn | 12/09/2025 03:29 PM | Pearland ISD | 1158 | 583 | 576 | 971 | 56 | 66 |
| 2 | 3 | alexjohn | 12/09/2025 03:29 PM | alexjohn | 12/09/2025 03:29 PM | Friendswood ISD | 1105 | 557 | 547 | 415 | 95 | 56 |
| 3 | 4 | alexjohn | 12/09/2025 03:29 PM | alexjohn | 12/09/2025 03:29 PM | Conroe ISD | 1103 | 555 | 548 | 3,385 | 67 | 53 |
| 4 | 5 | alexjohn | 12/09/2025 03:29 PM | alexjohn | 12/09/2025 03:29 PM | Galveston ISD | 1094 | 557 | 537 | 75 | 16 | 52 |
| 5 | 6 | alexjohn | 12/09/2025 03:29 PM | alexjohn | 12/09/2025 03:29 PM | Katy ISD | 1089 | 546 | 544 | 6,128 | 91 | 52 |
| 6 | 8 | alexjohn | 12/09/2025 03:29 PM | alexjohn | 12/09/2025 03:29 PM | Tomball ISD | 1078 | 543 | 535 | 1,420 | 96 | 54 |
| 7 | 9 | alexjohn | 12/09/2025 03:29 PM | alexjohn | 12/09/2025 03:29 PM | Fort Bend ISD | 1059 | 535 | 524 | 5,549 | 89 | 45 |
| 8 | 11 | alexjohn | 12/09/2025 03:29 PM | alexjohn | 12/09/2025 03:29 PM | Huffman ISD | 1057 | 542 | 515 | <125 | 42 | 42 |
| 9 | 12 | alexjohn | 12/09/2025 03:29 PM | alexjohn | 12/09/2025 03:29 PM | Deer Park ISD | 1056 | 527 | 529 | 381 | 39 | 47 |
| 10 | 14 | alexjohn | 12/09/2025 03:29 PM | alexjohn | 12/09/2025 03:29 PM | Humble ISD | 1054 | 538 | 516 | 1,859 | 52 | 44 |
| Rank | District | Composite | Reading | Math | # Tested | Participation | CCR |
Texas’s Top High Schools by SAT Score
For a more complete look at the statewide performance of schools, here are all campuses in Texas with a participation rate of 50% or higher. The Houston area has three schools in the top 10: SBAI, Carnegie Vanguard, and DeBakey.
| Rank | wdt_ID | wdt_created_by | wdt_created_at | wdt_last_edited_by | wdt_last_edited_at | School | District | Region | Composite | Reading | Math | # Tested | Participation | CCR |
|---|---|---|---|---|---|---|---|---|---|---|---|---|---|---|
| 1 | 1 | alexjohn | 12/09/2025 03:34 PM | alexjohn | 12/09/2025 03:34 PM | Spring Branch Academic Institute | Spring Branch ISD | Houston | 1478 | 740 | 738 | <25 | 86 | 100 |
| 2 | 2 | alexjohn | 12/09/2025 03:34 PM | alexjohn | 12/09/2025 03:34 PM | Lasa HS | Austin ISD | Austin | 1407 | 708 | 699 | <300 | 99 | 97 |
| 3 | 3 | alexjohn | 12/09/2025 03:34 PM | alexjohn | 12/09/2025 03:34 PM | School for the Talented and Gifted | Dallas ISD | Richardson | 1375 | 684 | 691 | <125 | 100 | 98 |
| 4 | 4 | alexjohn | 12/09/2025 03:34 PM | alexjohn | 12/09/2025 03:34 PM | Basis San Antonio-Shavano Campus | Basis Texas | San Antonio | 1374 | 683 | 691 | <75 | 100 | 96 |
| 5 | 5 | alexjohn | 12/09/2025 03:34 PM | alexjohn | 12/09/2025 03:34 PM | Carnegie Vanguard HS | Houston ISD | Houston | 1350 | 675 | 675 | <225 | 100 | 94 |
| 6 | 6 | alexjohn | 12/09/2025 03:34 PM | alexjohn | 12/09/2025 03:34 PM | School of Science and Engineering | Dallas ISD | Richardson | 1335 | 648 | 687 | <125 | 100 | 97 |
| 7 | 7 | alexjohn | 12/09/2025 03:34 PM | alexjohn | 12/09/2025 03:34 PM | DeBakey HS for Health Prof | Houston ISD | Houston | 1292 | 639 | 653 | 210 | 100 | 90 |
| 8 | 8 | alexjohn | 12/09/2025 03:34 PM | alexjohn | 12/09/2025 03:34 PM | Imagine International Academy | Imagine International Academy | Richardson | 1288 | 654 | 634 | 49 | 100 | 80 |
| 9 | 9 | alexjohn | 12/09/2025 03:34 PM | alexjohn | 12/09/2025 03:34 PM | Carroll Senior HS | Carroll ISD | Fort Worth | 1278 | 632 | 645 | 622 | 89 | 84 |
| 10 | 10 | alexjohn | 12/09/2025 03:34 PM | alexjohn | 12/09/2025 03:34 PM | Coppell HS | Coppell ISD | Richardson | 1275 | 629 | 646 | <875 | 88 | 81 |
| 11 | 11 | alexjohn | 12/09/2025 03:34 PM | alexjohn | 12/09/2025 03:34 PM | Uplift Education-North Hills | Uplift Education | Richardson | 1272 | 640 | 632 | 98 | 82 | 84 |
| 12 | 12 | alexjohn | 12/09/2025 03:34 PM | alexjohn | 12/09/2025 03:34 PM | Westlake HS | Eanes ISD | Austin | 1264 | 634 | 630 | 635 | 92 | 83 |
| 13 | 13 | alexjohn | 12/09/2025 03:34 PM | alexjohn | 12/09/2025 03:34 PM | Mansfield Frontier STEM Academy | Mansfield ISD | Fort Worth | 1257 | 626 | 631 | <75 | 100 | 95 |
| 14 | 14 | alexjohn | 12/09/2025 03:34 PM | alexjohn | 12/09/2025 03:34 PM | Westwood HS | Round Rock ISD | Austin | 1254 | 627 | 627 | 667 | 100 | 77 |
| 15 | 15 | alexjohn | 12/09/2025 03:34 PM | alexjohn | 12/09/2025 03:34 PM | Westlake Academy | Westlake Academy Charter School | Fort Worth | 1254 | 630 | 624 | <75 | 89 | 86 |
| 16 | 16 | alexjohn | 12/09/2025 03:34 PM | alexjohn | 12/09/2025 03:34 PM | Flower Mound HS | Lewisville ISD | Fort Worth | 1245 | 624 | 621 | 716 | 78 | 79 |
| 17 | 17 | alexjohn | 12/09/2025 03:34 PM | alexjohn | 12/09/2025 03:34 PM | Meridian World School LLC | Meridian World School LLC | Austin | 1241 | 631 | 610 | <50 | 57 | 77 |
| 18 | 18 | alexjohn | 12/09/2025 03:34 PM | alexjohn | 12/09/2025 03:34 PM | Independence HS | Frisco ISD | Richardson | 1240 | 623 | 618 | 286 | 94 | 76 |
| 19 | 19 | alexjohn | 12/09/2025 03:34 PM | alexjohn | 12/09/2025 03:34 PM | Clements HS | Fort Bend ISD | Houston | 1236 | 611 | 625 | 582 | 95 | 76 |
| 20 | 20 | alexjohn | 12/09/2025 03:34 PM | alexjohn | 12/09/2025 03:34 PM | Seven Lakes HS | Katy ISD | Houston | 1236 | 615 | 621 | 864 | 98 | 77 |
| 21 | 21 | alexjohn | 12/09/2025 03:34 PM | alexjohn | 12/09/2025 03:34 PM | Chaparral Star Academy | Chaparral Star Academy | Austin | 1226 | 629 | 596 | <25 | 100 | 75 |
| 22 | 22 | alexjohn | 12/09/2025 03:34 PM | alexjohn | 12/09/2025 03:34 PM | Centennial HS | Frisco ISD | Richardson | 1225 | 609 | 616 | <475 | 100 | 72 |
| 23 | 23 | alexjohn | 12/09/2025 03:34 PM | alexjohn | 12/09/2025 03:34 PM | The Woodlands HS | Conroe ISD | Huntsville | 1219 | 605 | 614 | 876 | 81 | 78 |
| 24 | 24 | alexjohn | 12/09/2025 03:34 PM | alexjohn | 12/09/2025 03:34 PM | Memorial HS | Spring Branch ISD | Houston | 1215 | 608 | 607 | 631 | 99 | 76 |
| 25 | 25 | alexjohn | 12/09/2025 03:34 PM | alexjohn | 12/09/2025 03:34 PM | Liberty HS | Frisco ISD | Richardson | 1211 | 605 | 607 | <425 | 99 | 71 |
| Rank | School | District | Region | Composite | Reading | Math | # Tested | Participation | CCR |
Most Popular Colleges for Texas Graduates
Students taking the SAT have the option to send their scores directly to the colleges of their choice; 61% of Texas students participated in this service. The most popular colleges among Texas, college-bound seniors were Texas A&M, University of Texas at Austin, and the University of Houston. The most popular private universities were Rice University (12th overall), Texas Christian University, and University of Dallas. The most popular out of state colleges were the University of Arkansas, University of Oklahoma, and Oklahoma State University.
| wdt_ID | wdt_created_by | wdt_created_at | wdt_last_edited_by | wdt_last_edited_at | Institution | State | Type | # of Students | % of Senders |
|---|---|---|---|---|---|---|---|---|---|
| 1 | alexjohn | 11/30/2025 05:57 PM | alexjohn | 11/30/2025 05:57 PM | Texas A&M University | TX | Public College | 50,495 | 28 |
| 2 | alexjohn | 11/30/2025 05:57 PM | alexjohn | 11/30/2025 05:57 PM | University of Texas at Austin | TX | Public College | 39,599 | 22 |
| 3 | alexjohn | 11/30/2025 05:57 PM | alexjohn | 11/30/2025 05:57 PM | University of Houston | TX | Public College | 28,131 | 16 |
| 4 | alexjohn | 11/30/2025 05:57 PM | alexjohn | 11/30/2025 05:57 PM | Texas Tech University | TX | Public College | 26,365 | 15 |
| 5 | alexjohn | 11/30/2025 05:57 PM | alexjohn | 11/30/2025 05:57 PM | Texas State University | TX | Public College | 19,715 | 11 |
| 6 | alexjohn | 11/30/2025 05:57 PM | alexjohn | 11/30/2025 05:57 PM | University of Texas at San Antonio | TX | Public College | 17,364 | 10 |
| 7 | alexjohn | 11/30/2025 05:57 PM | alexjohn | 11/30/2025 05:57 PM | Baylor University | TX | Private College | 16,334 | 9 |
| 8 | alexjohn | 11/30/2025 05:57 PM | alexjohn | 11/30/2025 05:57 PM | University of Texas at Dallas | TX | Public College | 14,923 | 8 |
| 9 | alexjohn | 11/30/2025 05:57 PM | alexjohn | 11/30/2025 05:57 PM | University of North Texas | TX | Public College | 12,002 | 7 |
| 10 | alexjohn | 11/30/2025 05:57 PM | alexjohn | 11/30/2025 05:57 PM | University of Texas at Arlington | TX | Public College | 11,685 | 7 |
| Institution | State | Type | # of Students | % of Senders |
Most Popular College Majors for Texas Seniors
Students taking the SAT are asked about their intended majors. The most popular majors among Texas high school seniors are Health Professions (14% of respondents), Business (13%), and Engineering (9%). Students intending to major in Physical Sciences earned the second highest average SAT scores with a 578 in Reading and 563 in math; the highest scores were earned by those intending to major in Mathematics and Statistics (598 in Reading and 618 in Math).
| wdt_ID | wdt_created_by | wdt_created_at | wdt_last_edited_by | wdt_last_edited_at | Major | Test Takers | Percent | Composite | Reading | Math |
|---|---|---|---|---|---|---|---|---|---|---|
| 1 | alexjohn | 11/30/2025 05:59 PM | alexjohn | 11/30/2025 05:59 PM | Health Professions and Related Clinical Sciences | 40,263 | 14% | 1,013 | 518 | 494 |
| 2 | alexjohn | 11/30/2025 05:59 PM | alexjohn | 11/30/2025 05:59 PM | Business, Management, Marketing, and Related Support Services | 39,248 | 13% | 1,021 | 519 | 503 |
| 3 | alexjohn | 11/30/2025 05:59 PM | alexjohn | 11/30/2025 05:59 PM | Undecided | 37,131 | 13% | 948 | 483 | 466 |
| 4 | alexjohn | 11/30/2025 05:59 PM | alexjohn | 11/30/2025 05:59 PM | Engineering | 27,155 | 9% | 1,116 | 557 | 560 |
| 5 | alexjohn | 11/30/2025 05:59 PM | alexjohn | 11/30/2025 05:59 PM | Biological and Biomedical Sciences | 25,911 | 9% | 1,096 | 560 | 537 |
| 6 | alexjohn | 11/30/2025 05:59 PM | alexjohn | 11/30/2025 05:59 PM | Visual and Performing Arts, General | 19,814 | 7% | 1,024 | 529 | 495 |
| 7 | alexjohn | 11/30/2025 05:59 PM | alexjohn | 11/30/2025 05:59 PM | Computer and Information Sciences and Support Services | 15,228 | 5% | 1,148 | 575 | 573 |
| 8 | alexjohn | 11/30/2025 05:59 PM | alexjohn | 11/30/2025 05:59 PM | Psychology, General | 14,755 | 5% | 1,049 | 544 | 505 |
| 9 | alexjohn | 11/30/2025 05:59 PM | alexjohn | 11/30/2025 05:59 PM | Security and Protective Services | 10,597 | 4% | 967 | 498 | 470 |
| 10 | alexjohn | 11/30/2025 05:59 PM | alexjohn | 11/30/2025 05:59 PM | Education | 10,349 | 4% | 986 | 508 | 478 |
| Major | Test Takers | Percent | Composite | Reading | Math |
How to Improve SAT and ACT Test Scores
College Admissions tests like the ACT and SAT should not be particularly mysterious. They simply test a student’s strengths in core academics like Math and English. In fact, a strong predictor of a student’s success on the SAT is their grade in challenging Algebra or English courses.
Top 5 Strategies to Improve Your SAT Test Score:
- Work hard in your English and Math courses, particularly Algebra I and Algebra II
- Take free practice tests (College Board offers at least 6), and get to know the test structure and format (see above)
- Learn from your mistakes; the majority of your prep should be re-learning what you’ve forgotten
- Learn some basic test-taking strategies like time management and how to read the questions
- Take the SAT or ACT at least twice; multiple test takers consistently see higher scores, and there are fee-waivers if you cannot afford the registration fee
Don’t get hung up on learning “tips and tricks.” There are no amount of tips and tricks that will overcome an inability to manipulate fractions or identify the main idea of a sentence. Also, don’t think that you simply “suck at math” or just need to “read more“. You can improve in all of these areas with a well-structured plan and dedicated resolve.
Ask your school for help. Every Texas school receives a government accountability rating from a scale of A-F. SAT and ACT scores are part of this rating. Your school administrators do not want to have low scores. As such, they do have the incentive and the money to help you do your best.
More College Prep Advice from General Academic
- Best Summer Opportunities for High School Students
- Test-Optional College Admissions for Texas Students
- College Essay Tips – Common App, Supplemental Essays, and More
- Houston’s National Merit Semifinalists for 2025-2026
- Houston ISD’s Best Elementary and Middle Schools by STAAR Scores 2025
Additional Sources
- HISD Facts and Figures
- College Board Texas Annual Report Class of 2024
- College Board 2025 SAT Suite Annual Report Total Group PDF
Notes
- The original dataset for Houston ISD’s Class of 2024 can be downloaded here.
- Accounting for demographics means to calculate a weighted average based off the same demographics between Houston, Texas, and the US. These three groups do not have the same demographics, so to do these calculations is an approximation.
SAT and PSAT FAQs
Students should start their test prep by taking both a mock ACT and digital SAT. The student’s performance and comfort on that diagnostic exam will then guide their choice of which test to ultimately prepare for the most—but preparing for one test also prepares them for the other.
Whether your child should take the SAT or the ACT is purely a matter of preference. With about 1.3 million students taking either tests every year, both are equally accepted nationwide. The SAT is more popular in Houston just because of historical preference, and Houston ISD pays for every junior to take the SAT because College Board won the contract (conversely ACT won the contract in North Carolina for example). Click here to see which state governments sold out to College Board (SAT) and which ones got bought by ACT.
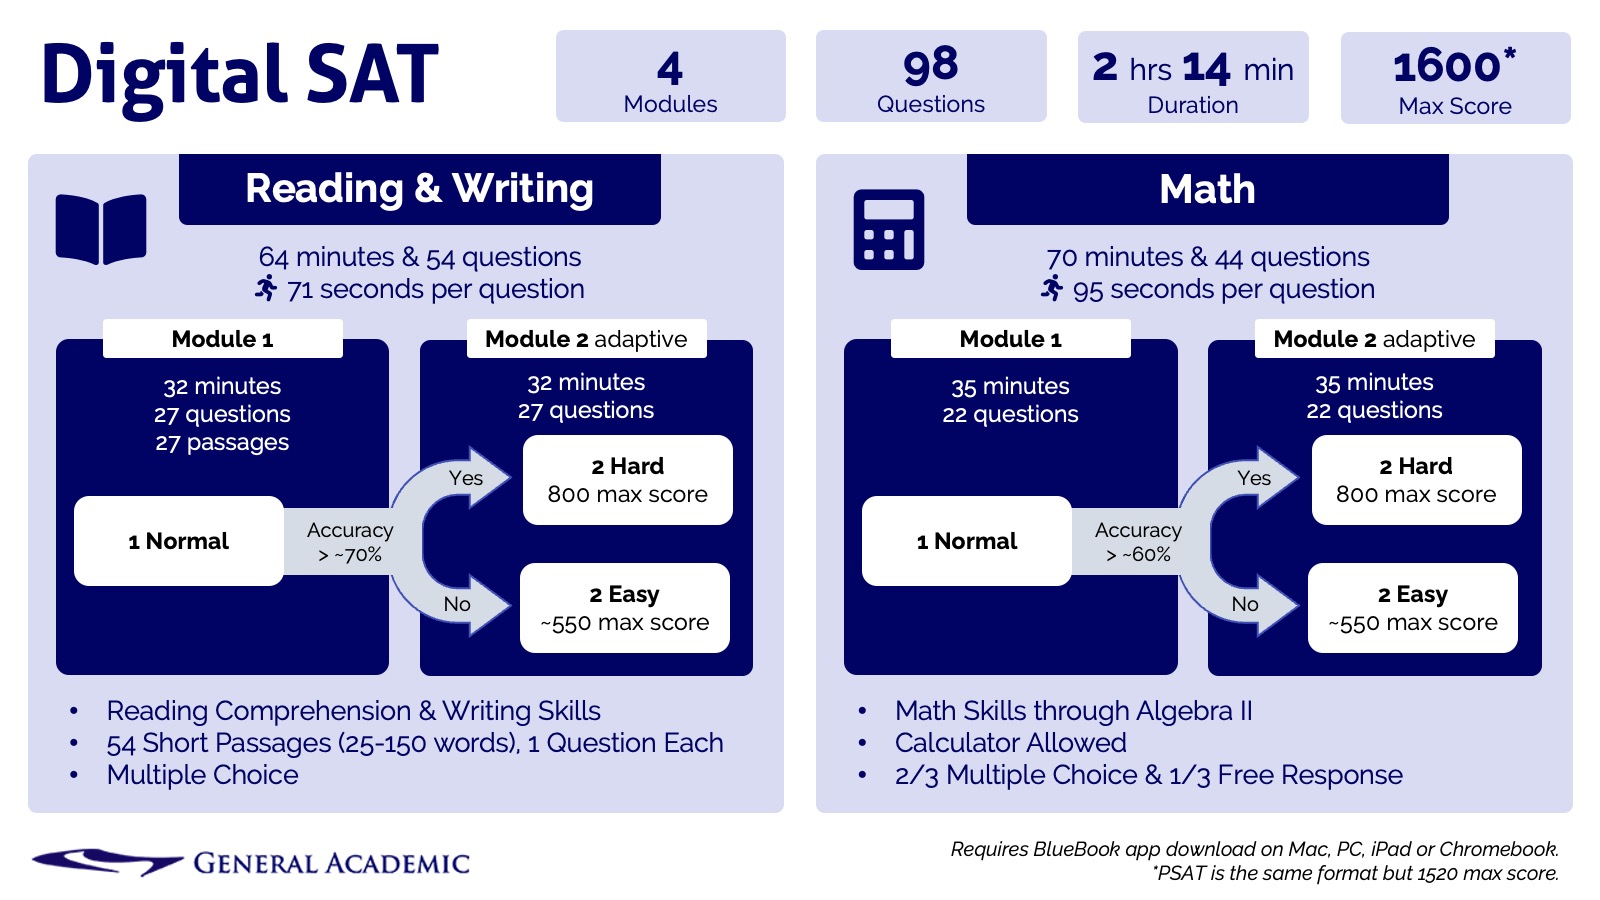
Both the Digital SAT (2024) and Enhanced ACT (2025) are relatively new and an hour shorter than the versions parents took. Furthermore:
- Digital SAT passages are only a few sentences versus more than 700 words for the ACT.
- The Enhanced ACT is offered both online and in paper
Taking a full-length mock test under timed conditions is one of the best ways to predict how your child will perform on the actual exam; it also helps them build the mental toughness necessary to perform reliably on test day.
There’s a big difference between working 10, untimed questions at the kitchen table with the aid of a tutor versus slogging through 161 unassisted questions in a room with other kids all at the same time.
We offer complimentary diagnostic mock testing for ISEE, ACT, and SAT to both current and future clients. For current clients, we also offer ongoing mock testing when our guidelines for properly spacing out practice tests is followed.
Ideally, students will complete at least 3 full-length practice tests before they take the ISEE, SAT, or ACT exam. However, parents should be careful not to force students to take mock tests in quick succession without sufficient studying.
We expect students to complete a minimum of 20 hours of tutoring and self-study between each mock test. Forgoing this recommendation risks demoralizing students and/or being disappointed by lack of perceived improvement.
Students working with us have access to more than 12 full-length practice tests.
General Academic recommends that rising high school juniors start preparing for the ACT and/or SAT in the summer (June/July) in the lead up to the fall test dates (August/ November). This timeline allows the student to work around particularly stressful periods like mid-term and final exams. It provides ample time to prepare not only for the first, fall test date but also a second or third testing in the spring of their junior year.
Ultimately, the goal is to have the student finished with their testing by the May test date as a sanity check and to leave the summer period open for their college applications and essays. However, the student will still have plenty of opportunities for more testing in June, August, October (latest for early decision), and November (recommended latest for regular decision), but this would be on top of their applications and regular schoolwork in the fall of their senior year.
The most valuable resource in test preparation is time. The most difficult math topics tested on the SAT and ACT are Algebra II and some trigonometry, which most students will have already learned by the start of their junior year. Therefore, in order to avoid regretting not having started early enough, the summer before junior year is the best time to start.
With that said, “test prep burnout” is a very real phenomena. Parents should avoid cramming too much test prep into an especially tight or stressful period of time, and they should accept if students are already scoring at their peak ability.
In response to the new Digital SAT test rolled out in 2024, competitor ACT also announced that they would overhaul their exam beginning as early as spring 2025. The updated ACT test is shorter (2 hours) and makes the dreaded Science Test optional. Scoring remains on a scale of 1-36, and the test will differentiate itself from the Digital SAT in that it will be offered on both paper and computer.
Most General Academic high school juniors will take the ACT or SAT two or three times to ensure they earn the score they need. There is no penalty for taking the test multiple times, and colleges only care about the highest score.
Note that most juniors will also take the PSAT in October for National Merit Scholarship qualification.
The SAT is generally offered to Houston-area students eight times a year:
- August
- October
- November
- December
- March
- April (all Houston ISD juniors in-class, automatically registered and paid)
- May
- June
Students need to register online at CollegeBoard.org at least four weeks in advance to avoid late-registration penalties and ensure availability. Most General Academic students will take the SAT in November, March, and May of their junior year.
The ACT is generally offered nationally seven times a year:
- September
- October
- December
- February
- April
- June
- July
Students need to reegister online at ACT.org at least five weeks in advance to avoid late-registration penalties and ensure availability. Most General Academic students will take the ACT in October, February, and April of their junior year.
The genuinely not-waffling answer is that every student is different. How long your child needs to spend preparing depends primarily on:
- What score do they want to achieve?
- What score do they have right now?
- How big is the gap between their goal and current scores?
However, the overly simplified answer is:
- For the SAT, students can expect about a 40-point improvement for every 7 hours of quality preparation
- For the ACT, students can expect about a 1-point improvement for every 7 hours of quality preparation
The operative word in this basic response is “quality.” Students cannot spend those 7-hours just watching videos on Khan Academy while simultaneously posting to Tik Tok. They need to be actively engaged in the material, taking practice tests, and truly learning from their mistakes.
The majority of the time spent on test prep is remediating basic math and English skills. No amount of tips, tricks, or talking-head watching will make up for not being able to actually identify the main idea of a paragraph or manipulate fractions.
The shorter answer is that students who have the means and time to prepare and take the ACT or SAT should absolutely do so.
Colleges like standardized tests because they’re norm-referenced and their scores are comparable across the entire US population regardless of school and curriculum. However, the uncomfortable outcome of testing is results. And historically standardized testing shows enormous performance gaps between students from different socioeconomic backgrounds.
It’s this measured gap between students of different backgrounds that largely propels the test-optional movement. Furthermore, the COVID-19 pandemic led to additional challenges like simply not being able to get students in a room to test. As a result, colleges raced to go test-optional, and some university systems like the state of California even went test-blind in 2022.
While colleges are reluctant to publish their admissions data, since-redacted statistics from the pandemic and off-the-cuff remarks from admissions officers, demonstrated that students who submitted scores were often twice as likely to gain admission. The basic premise is that only students with something to hide didn’t submit scores.
But why did that happen even when it was the colleges’ policy to be “test-optional” and technically not penalize students who didn’t submit scores? There’s at least two reasons—submitting strong scores is another, positive data point, and admissions officers are still human. Would a car buyer rather choose the model that got “sufficient gas mileage” or the one that gets “50 miles per gallon” or “400 miles of range”?
Furthermore even less well-off students can reap huge rewards from submitting high test scores. For example, a low-income high school student is more able to ace the ACT or SAT than attend a rich, academically competitive school, participate in a bevy of after-school activities, and spend hundreds of hours on unpaid, volunteer work.
Click here to read more about our analysis of test-optional admissions.